## When to prune

- **Keep full $W$:** strength, exact paths, flow conservation
- **Extract backbone:** visualization, community detection on dense graphs, denoising

Pruning is a modeling choice, not a default. Know what each edge represents before deleting it.Weighted networks
Fundamental quantities
Summary: Menczer Chapter-4
- Information Networks:
- Examples: Wikipedia, the Web, biological networks (brains), communication networks (email, Internet), transportation networks (air flights), social media (Twitter).
- Links are directed and often weighted (intensity of interaction, similarity, traffic flow).
- Features of Directed and Weighted Networks:
- Web Network:
- Huge information network with pages connected by hyperlinks.
- Browsers navigate links using HTTP, content presented in HTML.
- Web Structure:
- Nodes represent pages or websites.
- Heavy-tailed distribution of in-degree, ultra-short paths, popular hub pages.
- Large strongly connected component.
- Text Similarity:
- Represent documents as high-dimensional word vectors.
- Cosine similarity to measure text similarity among pages.
- Web has clustered structure with semantically related pages.
- PageRank:
- Node centrality measure based on a random walk model.
- Measures the prestige of Web pages.
- Important for ranking search engine results.
- Information Diffusion Networks:
- Track spread of content on social media (retweets, links, images, hashtags).
- Identify viral concepts and influential accounts.
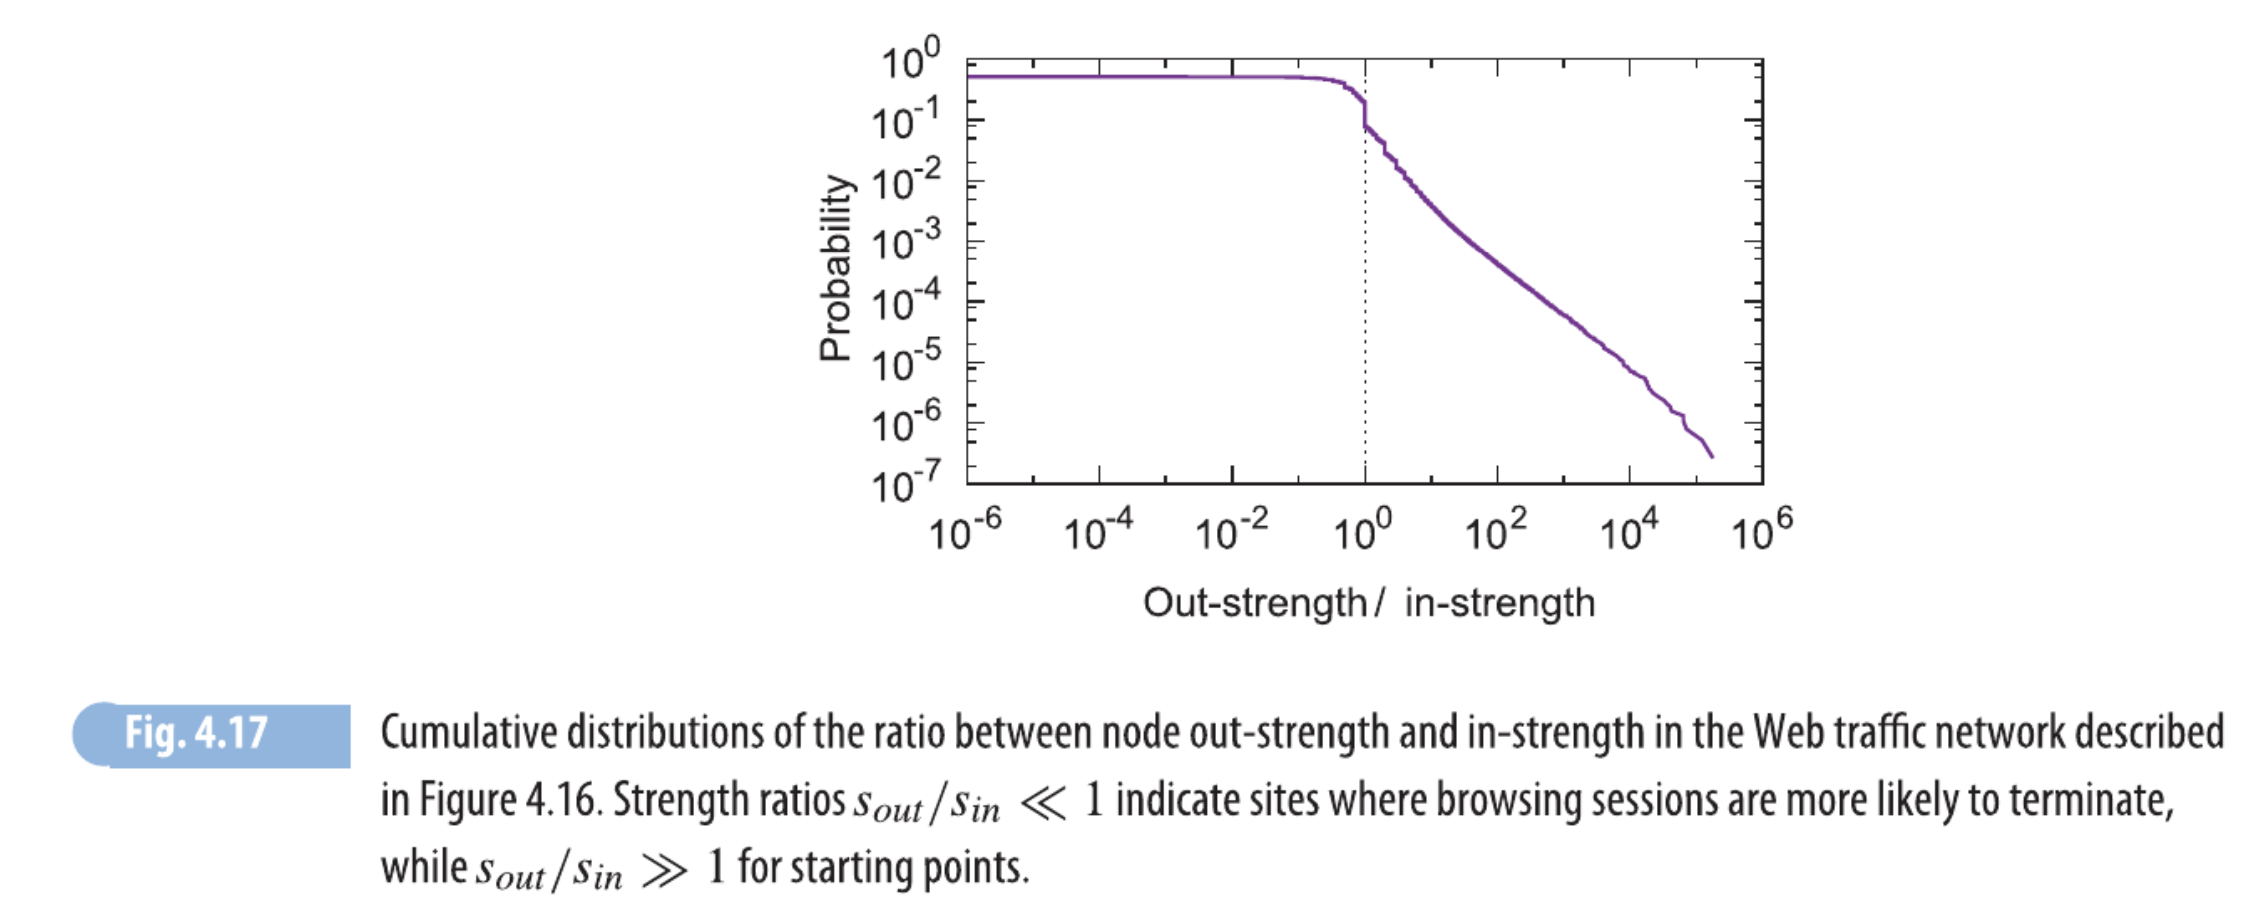
- Node out-strength and in-strength to characterize information producers and consumers.
- Weighted Networks from Bipartite Graphs:
- Links weighted by co-occurrence relations (co-citations, product recommendations, word/tag similarity).
- Web Network:
- Weighted Network Pruning:
- Dense networks may need pruning by filtering low-weight links.
- Heavy-tailed weight distributions require local weight thresholds.
- Extract backbone of the network by identifying statistically significant links.
Motivation
Weighted networks capture the intensity of connections, providing more detailed insights into interactions, influence, and network dynamics than unweighted networks.
A weight encodes intensity, capacity, or distance.
Examples of weighted networks
Unweighted graphs treat every edge as identical. Real connections are not.
- Traffic volume between airports
- Citation counts between papers
- Synaptic strength between neurons
- Trade flow between countries
- Co-authorship frequency
Two flavors of weight
Before computing anything, ask what a large weight means.
- Affinity / similarity: larger = closer (friendship strength, trade volume)
- Cost / distance: larger = farther (travel time, resistance)
Most algorithms silently assume one or the other. Mix them and you get nonsense, like shortest paths routed through your strongest friendships.
Representation: Weighted adjacency
Weighted adjacency matrix \(W\), entry \(w_{ij}\) is the weight of edge \(i \to j\).
Running toy network (undirected): edges A-B = 5, A-C = 1, A-D = 4, B-C = 2, C-D = 3.
\[W = \begin{pmatrix} 0 & 5 & 1 & 4 \\ 5 & 0 & 2 & 0 \\ 1 & 2 & 0 & 3 \\ 4 & 0 & 3 & 0 \end{pmatrix}\]
Directed networks make \(W\) asymmetric. Zeros mark absent edges.
Node strength: Uni-directed case
Strength generalizes degree: sum the weights instead of counting edges.
\[s_i = \sum_j w_{ij}\]
| Node | Degree \(k\) | Strength \(s\) |
|---|---|---|
| A | 3 | 10 |
| B | 2 | 7 |
| C | 3 | 6 |
| D | 2 | 7 |
C has more neighbors than B (3 vs 2) yet less strength (6 vs 7). Degree and strength rank nodes differently.
Affinity to distance
Shortest-path algorithms minimize cost. If your weights are affinities, invert them first.
\[d_{ij} = \frac{1}{w_{ij}}\]
Path A \(\to\) B \(\to\) C with affinities \(w_{AB}=5\), \(w_{BC}=2\):
\[d = \tfrac{1}{5} + \tfrac{1}{2} = 0.7\]
A strong-but-indirect route can beat a weak direct edge. Skip this inversion and Dijkstra routes through your heaviest edges, the opposite of intent.
Importance of Strength
- Influence: High out-strength marks influential or active nodes; high in-strength marks popularity.
- Activity: Summarizes a node’s total interaction level.
- Weights: Captures more network detail than just counting edges, crucial where tie strengths vary.
Applications:
- Social media: Out-strength = user’s tweets retweeted; in-strength = retweets by user.
- Transportation: Out-strength = passengers departing; in-strength = passengers arriving.
- Email: Out-strength = emails sent; in-strength = emails received.
Strength highlights key nodes and reveals how influence and activity are distributed.
Weighted clustering
Binary clustering asks: are my neighbors connected? Weighted clustering asks: are my strong neighbors connected?
Barrat et al.:
\[C_i^w = \frac{1}{s_i (k_i - 1)} \sum_{j,h} \frac{w_{ij} + w_{ih}}{2}\, a_{ij} a_{ih} a_{jh}\]
- Triangles built on heavy edges count more.
- \(C_i^w > C_i\): strong ties cluster. \(C_i^w < C_i\): strong ties reach outward, weak ties form the triangles.
Weighted centrality
The recipe: replace \(A\) with \(W\).
- Strength: the simplest centrality (degree becomes strength)
- Eigenvector / PageRank: \(W\) propagates influence, heavy edges pass more
- Betweenness: shortest paths weighted by cost
One caution dominates: confirm whether weights are affinities or costs before feeding any algorithm.
Strength: Directed case
Directed weighted graphs split strength by direction:
\[s_i^{\text{in}} = \sum_j w_{ji}, \qquad s_i^{\text{out}} = \sum_j w_{ij}\]
- Out-strength: flow a node sends (exports, outbound citations)
- In-strength: flow it receives (imports, inbound citations)
The imbalance \(s^{\text{out}} - s^{\text{in}}\) flags net sources versus sinks.
Measures total influence sent (out) or received (in).
Weight Heterogeneity
- Weighted Network Significance:
- Link weights carry important information about processes or relationships.
- Different weights represent different associations.
Weight heterogeneity
A node’s edges are rarely equal, and strength alone hides this.
Two nodes, both with strength 10:
| Neighbor weights | Character |
|---|---|
| 4, 3, 3 | even |
| 8, 1, 1 | dominated by one |
Same strength, very different structure. We need a measure of concentration.
Disparity measure
Strength tells you the total weight at a node, not how it is spread. The disparity measure captures the spread.
First, the share each edge carries of node \(i\)’s strength:
\[p_{ij} = \frac{w_{ij}}{s_i}, \qquad \sum_j p_{ij} = 1\]
Then sum the squared shares:
\[Y_i = \sum_j p_{ij}^{\,2} = \sum_j \left( \frac{w_{ij}}{s_i} \right)^2\]
Squaring rewards concentration: a few large shares dominate the sum.
| Node | Weights | Shares \(p_{ij}\) | \(Y_i\) | \(1/Y_i\) |
|---|---|---|---|---|
| even | 4, 3, 3 | .4, .3, .3 | 0.34 | 2.9 |
| skewed | 8, 1, 1 | .8, .1, .1 | 0.66 | 1.5 |
Read \(1/Y_i\) as the effective number of edges: how many neighbors the node behaves as if it had, if those ties were equal. Both nodes have three neighbors, but the skewed node leans on ~1.5 of them; the rest are almost dead weight.
Limiting cases: all edges equal gives \(p_{ij} = 1/k_i\), so \(Y_i = 1/k_i\) and \(1/Y_i = k_i\) (you “use” every edge). One edge dominating drives \(Y_i \to 1\) and \(1/Y_i \to 1\) (effectively a single tie).
Example:
- Traffic Networks:
- Capture various kinds of traffic.
- Examples:
- Air/Transportation Networks: Weights represent passengers or flights between airports, cars between intersections.
- Internet: Weights denote packets or bits of data between routers.
- Wikipedia: Weights represent clicks between articles.
- Focus Example:
- Web traffic network: Similar to Wikipedia but includes all websites. ## Monitoring Web traffic
- Methods:
- Browsers, toolbars, or extensions record click data and transmit it to a server.
- ISPs monitor packets carrying HTTP/HTTPS requests, including target host/page and source URL (referer).
- Bias in Data Collection:
- Browser-based method: Only captures traffic from users with traffic-monitoring software.
- ISP-based method: Only captures packets passing through ISP routers.
- Advantages:
- Both methods enable large collections of Web traffic data.
- Data Analysis:
- Can count clicks between individual pages.
- Consider aggregate traffic at the level of entire websites identified by hostnames. ## Node strength distribution
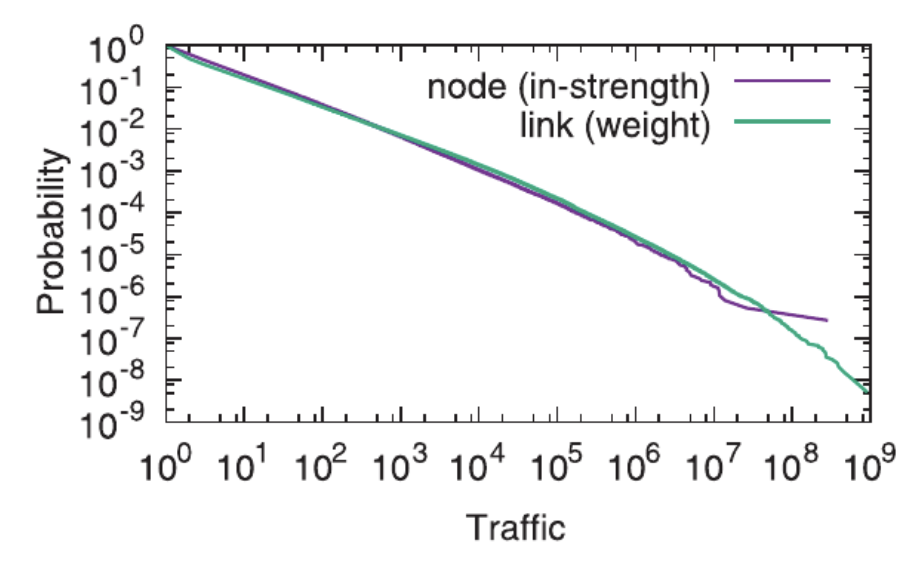
- Cumulative distributions of node in-strength (website traffic) and link weight in a Web traffic network.
- Almost one billion clicks, representing the combined Web browsing activities of about 100,000 anonymous users
- Collected by Indiana University between 2006 and 2007.
- The resulting network has about 4 million sites and 11 million weighted directed links
 ## Example: Web Traffic
Link Filtering and Network Backbones
What is a backbone?
A backbone is a sparse subgraph that keeps the important edges and drops the rest. Same nodes, far fewer edges: the skeleton that carries the network’s structure.
Why: real weighted networks are dense and noisy. Most edges are weak or redundant and hide what matters.
Two ways to define “important”:
- Global rule: one network-wide criterion (weight threshold, maximum spanning tree, high betweenness). Blind to local context, so a node whose ties are all weak loses every edge.
- Local rule: judge each edge against its own node’s weights. The disparity filter keeps edges heavier than a node would spread at random, preserving significant ties at every scale.
A backbone is a modeling choice. The criterion encodes what you think matters, so one network has different backbones under different rules.
Example: Network Backbone extraction
- Flavor Network:
- Nodes: Represent ingredients.
- Color: Indicates food category.
- Size: Reflects ingredient prevalence in recipes.
- Links: Connect ingredients sharing flavor compounds.
- Link Width: Represents the number of shared compounds.
- Visualizations:
- Full network shown in the inset.
- Main image shows the backbone network with significant links (w = 0.04).
- Nodes: Represent ingredients.
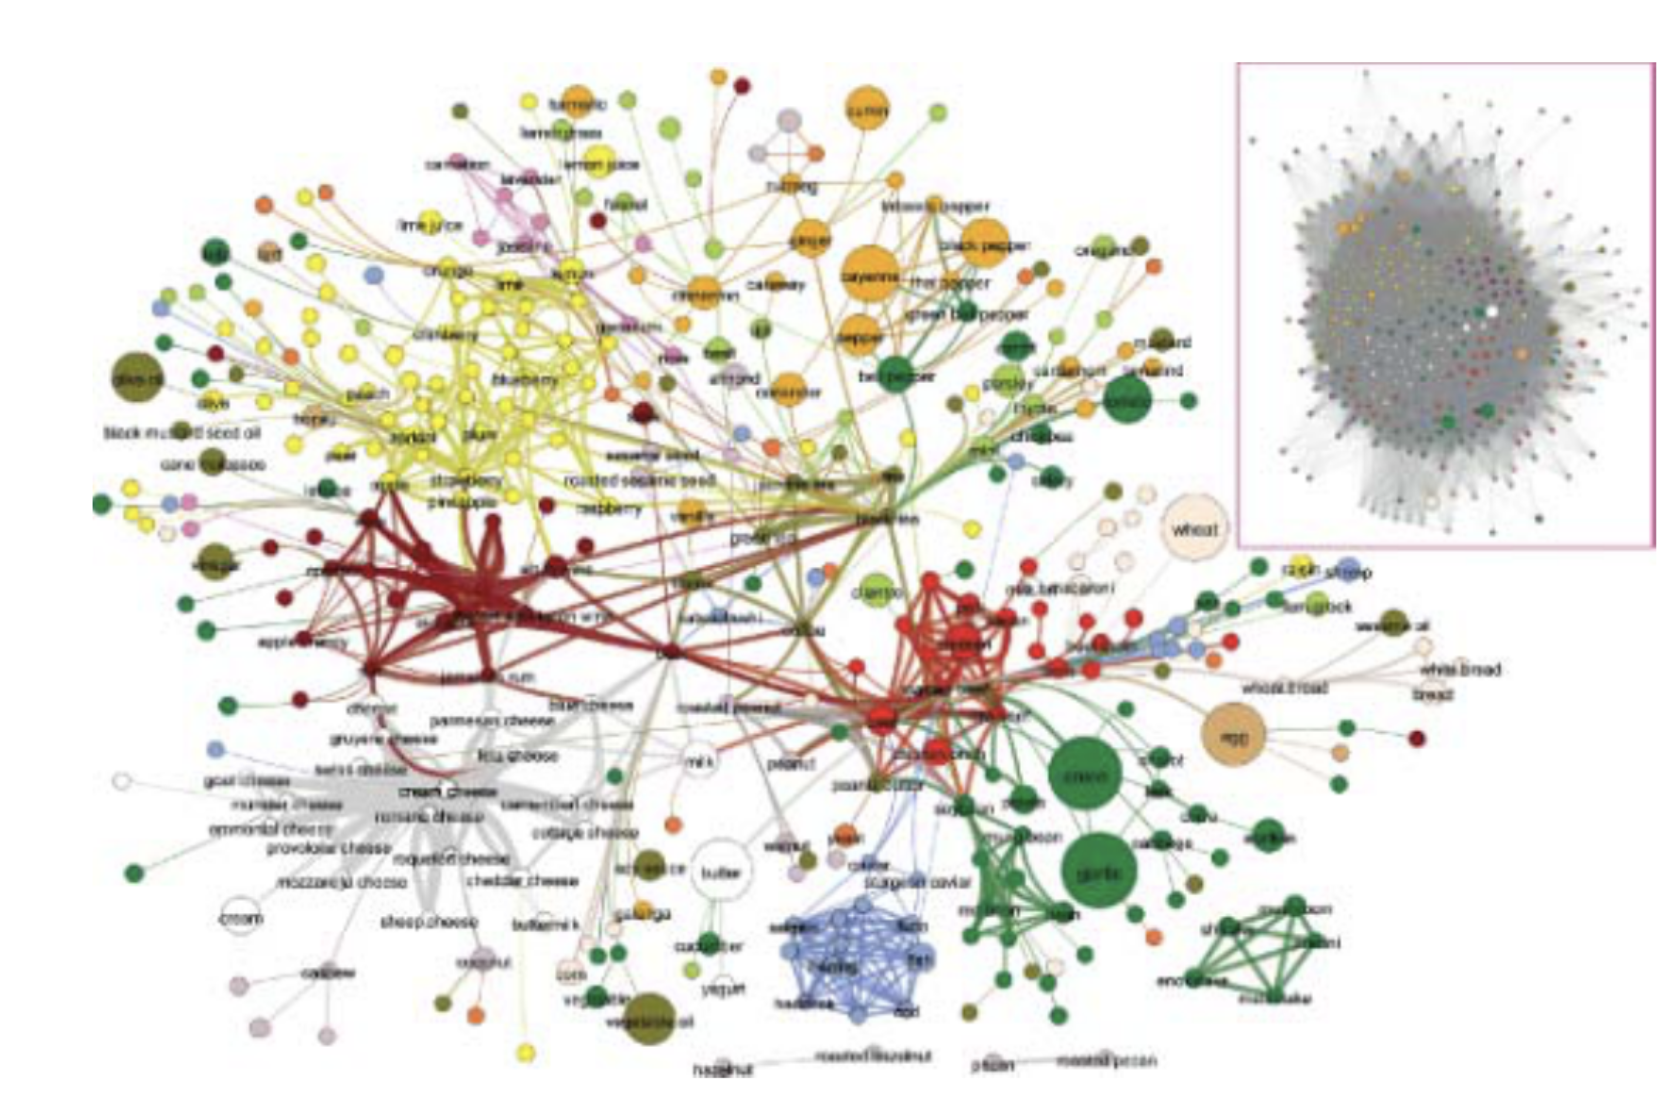
Source: Adapted from Ahn et al. (2011) under CC BY 4.0 license.
The density problem
Dense weighted networks are often slow to analyze. We want the essential edges.
Naive global threshold: drop every edge below some \(w^{*}\).
The flaw: a node whose ties are all weak loses every edge, even when those ties are locally its most important. A global cutoff erases locally significant weak ties.
Additional Motivation for link Filtering
- Challenges with Dense Networks:
- Difficult to visualize and study (“hairballs”).
- Contain many unimportant links
- Many links may not be significant.
- Need for Pruning:
- Prune low-weight links in weighted networks.
- Essential for co-occurrence networks to remove noise.
- Example:
- Network of documents or Web pages linked by text similarity (shared keywords).
- Unrelated documents may share a few generic keywords, creating insignificant links.
- Goal:
- Filter out low-weight links to obtain a sparser, more meaningful network.
When to prune
- Keep full \(W\): strength, exact paths, flow conservation
- Extract backbone: visualization, community detection on dense graphs, denoising
Pruning is a modeling choice, not a default. Know what each edge represents before deleting it.
Pruning Method-1: Threshold
- Simplest Pruning Approach:
- Remove all links below a certain weight threshold.
- Effective in many settings.
- Challenges with Global Threshold:
- Ineffective for networks with heavy-tailed distribution of link weights.
- Common in co-occurrence, traffic, and other weighted networks.
- Issues with Heterogeneous Weights:
- Hard to find a suitable threshold.
- Risk of preserving insignificant links.
- Risk of disconnecting low-strength nodes by removing significant low-weight links.
- Significance of links varies depending on node strength.
Pruning Method-2: Disparity filter
Serrano et al.: judge each edge against its own node’s weight distribution.
Normalized weight \(p_{ij} = w_{ij}/s_i\). Null model places \(k\) weights uniformly at random.
\[\alpha_{ij} = (1 - p_{ij})^{\,k_i - 1}\]
Keep the edge if \(\alpha_{ij} < \alpha\) (heavier than the random baseline). This preserves significant ties at every scale, hub and periphery alike.
Additioanl Examples of weighted networks
Information diffusion network overview
- Diffusion network’a are classic examples of a weighted network
- Nodes represent people; links represent pieces of information (memes).
- Memes include images, movies, Web links, phrases, hashtags.
- Tweets can carry multiple memes (e.g., hashtags and links in one message).
- Each meme identified by a
text string(URL) orhashtag.- Hashtags prefixed by the hash mark (#) express concepts or topics.
Diffusion network definition
- Meme Propagation:
- Same meme can create multiple cascade trees (stars).
- Example: multiple users sharing the same link or hashtag.
- Aggregation:
- Aggregating star trees forms a forest, called the diffusion network.
- Building a Diffusion Network:
- Identify the meme(s) to analyze.
- Example interests: single hashtag (#elections, #soccer), all links to specific news sources.
- Investigating Misinformation:
- Track stories from low-credibility sources (fabricated news, hoaxes, conspiracy theories, hyper-partisan content, click bait, junk science).
- Multilayer Network:
- Cascade forest for each hashtag forms a layer in a multilayer network.
- Temporal Network:
- Retweets occur at different times, making it a temporal network.
- Diffusion Network Example:
- Figure 0.3: Aggregated cascade forests across time and popular hashtags.
- Context: Political conversations during the 2010 US midterm election.
Twitter diffusion network
- Capture meme spread via retweets, quoted tweets, mentions, and replies.
- Example: Alice mentions Bob; Bob sees the tweet (spread from Alice to Bob).
- Example: Alice replies to Bob; original message delivered from Bob to Alice.
- Focus on retweets for simplicity.
- Alice retweets Bob’s message, spreading the meme to Alice’s followers.
Retweet cascade:directed tree showing meme propagation from originator to exposed users.- Difficult to reconstruct cascade tree from Twitter data.
- Star Network:
- Users exposed to the meme are connected to the origin, forming a star network.
- Possible to approximate the cascade tree if the underlying follower network is known.
Observing Diffusion Networks
Spread Patterns:
Uniform vs. concentrated within dense, segregated clusters.
Example: Polarized structure with two segregated communities (conservatives and progressives), forming echo chambers.
Example: Echo chambers vulnerable to political misinformation, sharing few fact-checked articles.
Virality of Memes:
Quantified by the size of the diffusion network (number of users exposed).
Network structure also important:
- Star networks indicate popularity of the source (e.g., a celebrity).
- Deep networks with long retweet chains suggest wider appeal of the message.
- Misinformation often more viral than actual news.
Insights from Diffusion Networks:
Reveal patterns of information production and consumption.
Weighted and directed retweet networks show how many times a meme is propagated between users.
Information and Misinformation
- Out-strength as an Indicator of Influence:
- High out-strength indicates influence (messages retweeted a lot).
- Contrast with in-degree (number of followers), which measures popularity but not necessarily influence.
- Comparing retweets vs. followers provides a better sense of influence.
- Manipulation of Social Media:
- Fake followers can boost perceived popularity (increase in-degree).
- Social bots create fake tweets, simulate grassroots campaigns, and amplify messages.
- Bots can hijack public attention and manipulate ranking algorithms.
- Illustrations of Manipulation:
- Bots amplify misinformation and manipulate public debates.
- Fake replies and mentions target influential users (e.g., reporters, politicians) to spread misinformation.
- Examples of such manipulation are shown in Figures 4.12, 4.13, and 7.1.
- Platforms Exploited for Misinformation:
- Twitter, Facebook, Instagram, and WhatsApp are used for spreading misinformation.
Example-1: Retweet network
- Retweet sub-network (52,452 nodes, showing the K = 5 core) for articles during the 2016 US election
Nodes= Twitter accountlink= Retweet linking to an article |low-credibility(purple) articlefact-checking(orange) source.
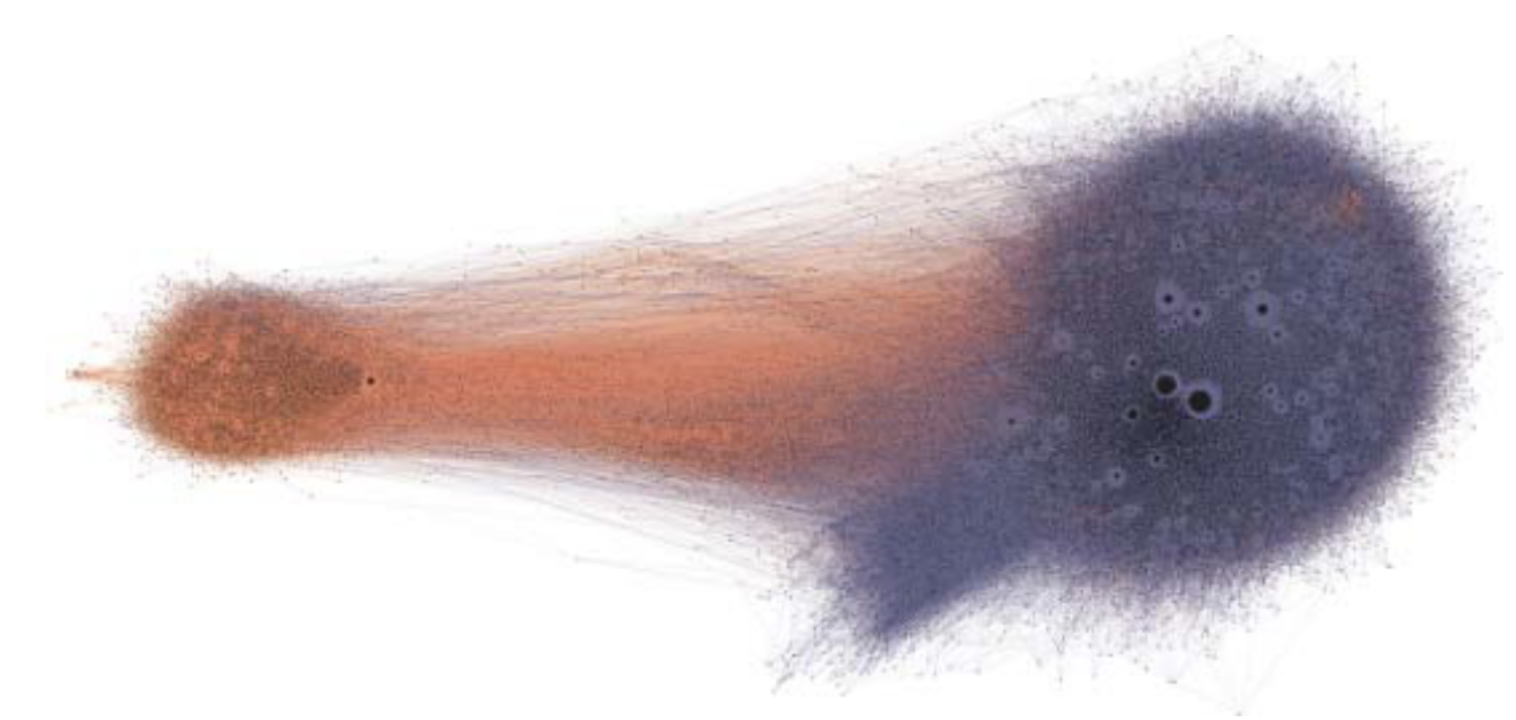
Image adapted from Shao et al. (2018a) under CC BY 4.0 license.
Example-2: Mis-information in a retweet network
- Retweet network for
two articlesabout a volunteer organization targeted by a disinformation campaignNode sizeis proportional toout-strength
- Mis-Information
Gray links: diffusion of false claimsred nodes=likely bots.Node color\(\rightarrow\)probability account is automated:
- Information
Yellow links: fact-checking articlesblue nodes=likely human
- Notice how the spread of the misinformation is
more viral
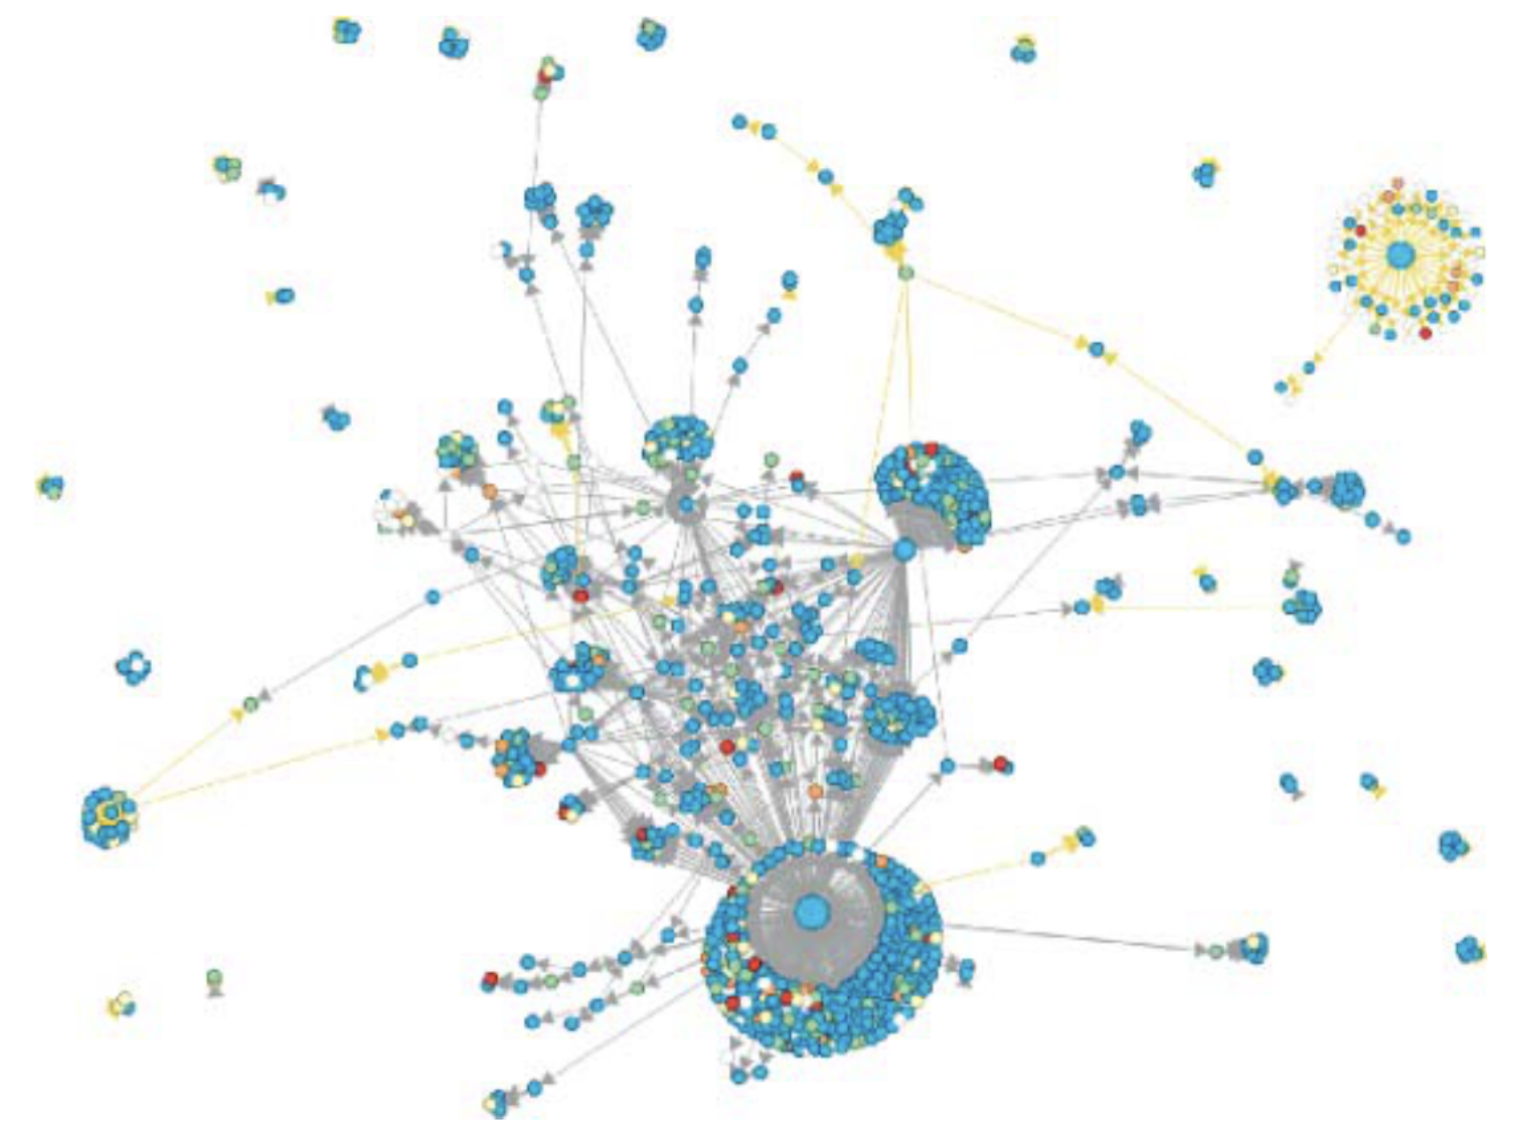
Image from Hoaxy, a tool that visualizes the spread of misinformation on Twitter
Example-3: False news
- Fake News Diffusion Network (2016 US Election):
- Fake news report on massive voter fraud by illegal aliens, debunked by fact checkers.
- Article shared over 18,000 times on Twitter.
- Visualization Details:
- Node Size: Represents the number of followers of an account.
- Links:
- Blue: Spread by retweets or quoted tweets.
- Red: Spread by replies or mentions.
- Link Width: Represents the number of retweets, quotes, replies, and mentions between two accounts.
- Notable Nodes and Links:
- Small yellow node near the center is a bot.
- Bot tweets misinformation in replies to messages mentioning the US President.
- Thick red link connects the bot andrealDonaldTrump?.
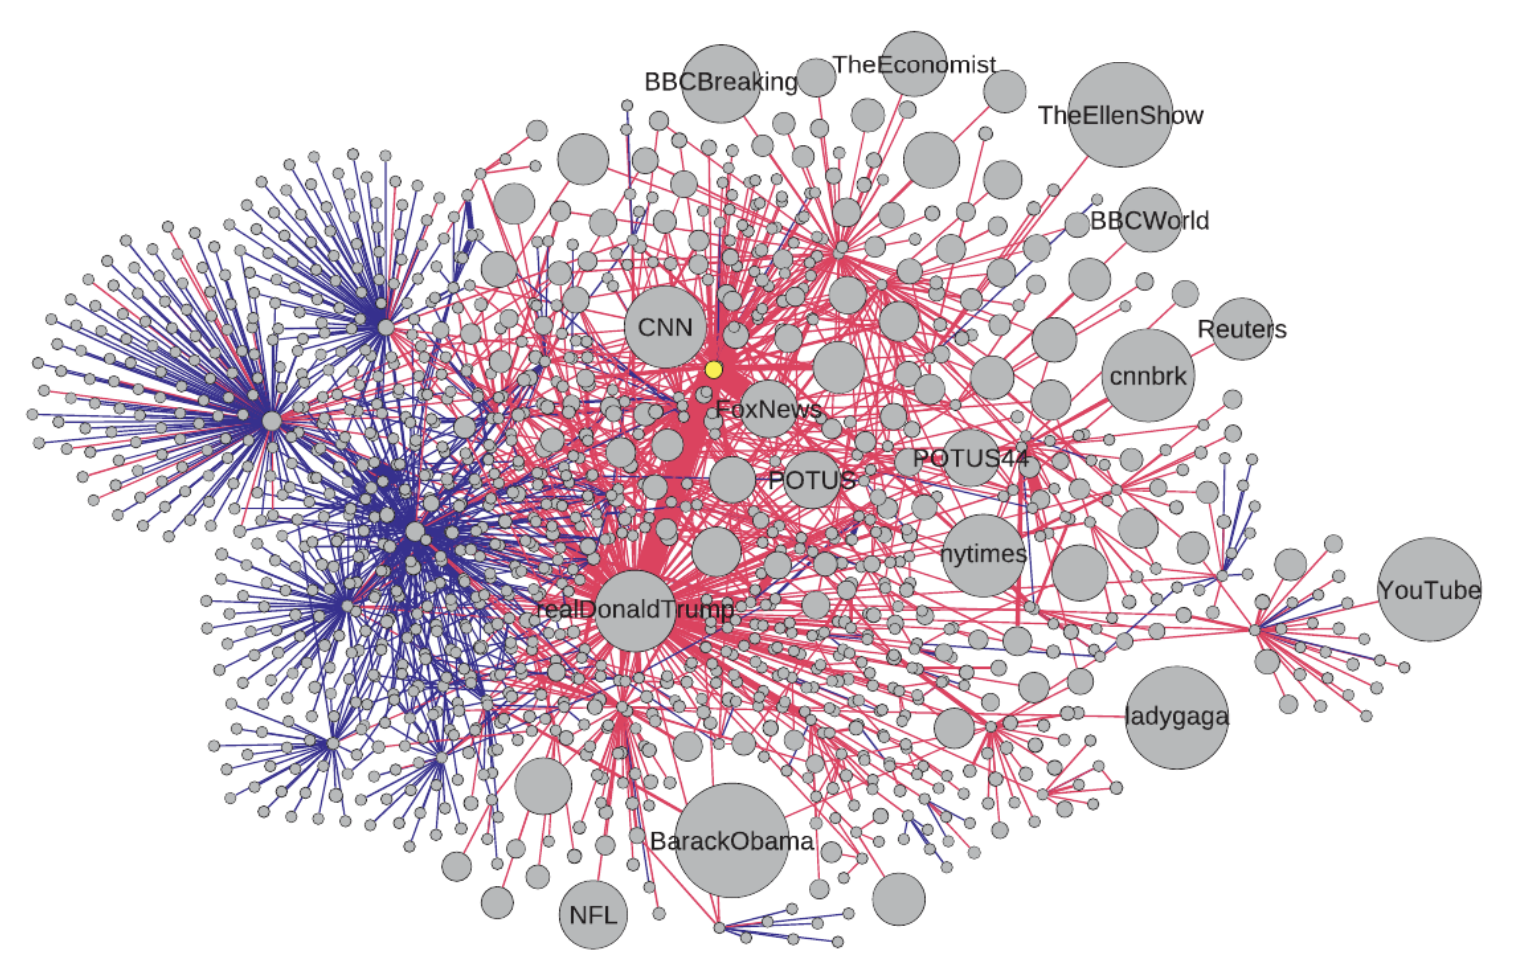
- Source: Image from Shao et al. (2018b) under CC BY 4.0 license.
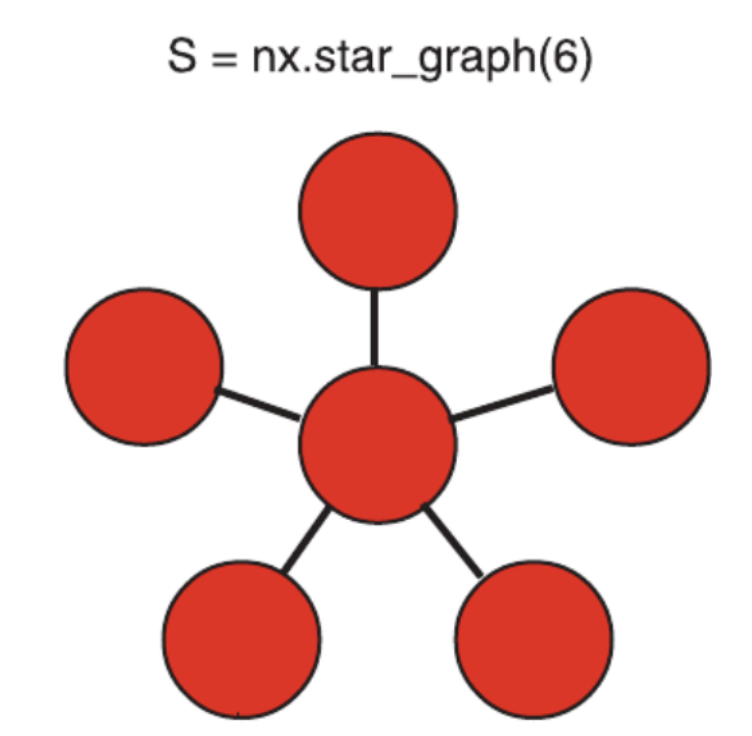
Recall: Star networks
- Central node connected directly to multiple peripheral nodes.
- All peripheral nodes have a direct link only to the central node.
- No direct links between peripheral nodes.
- Common in diffusion networks where a single source spreads information to many recipients.
- Example: retweet cascade where many users retweet a meme from one original tweet.
- Forms a “star” shape with the originator at the center and followers as the spokes.
Recall: Tree networks
- Hierarchical structure with nodes and edges.
- One root node (origin) with no parent.
- Each node (except the root) has one parent node.
- Nodes may have zero or more child nodes.
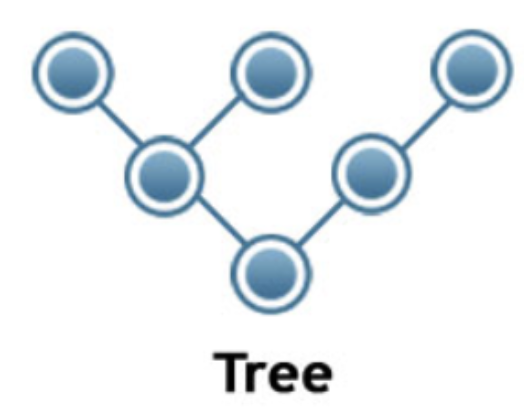
Example: Retweet cascades tree’s vs start networks
bfollowsaand also retweets a message froma(a=root node).cfollowsa, but does not retweet a.- User may retweet messages retweeted by someone they follow.
hdoes not followa, but retweetsa’s message retweeted byg, who is followed byh.
- Tracing these retweet chains, in theory we can reconstruct retweet cascade tree with
- Twitter does not provide data about retweet cascades \(\rightarrow\)
cascade treebecomes astar network
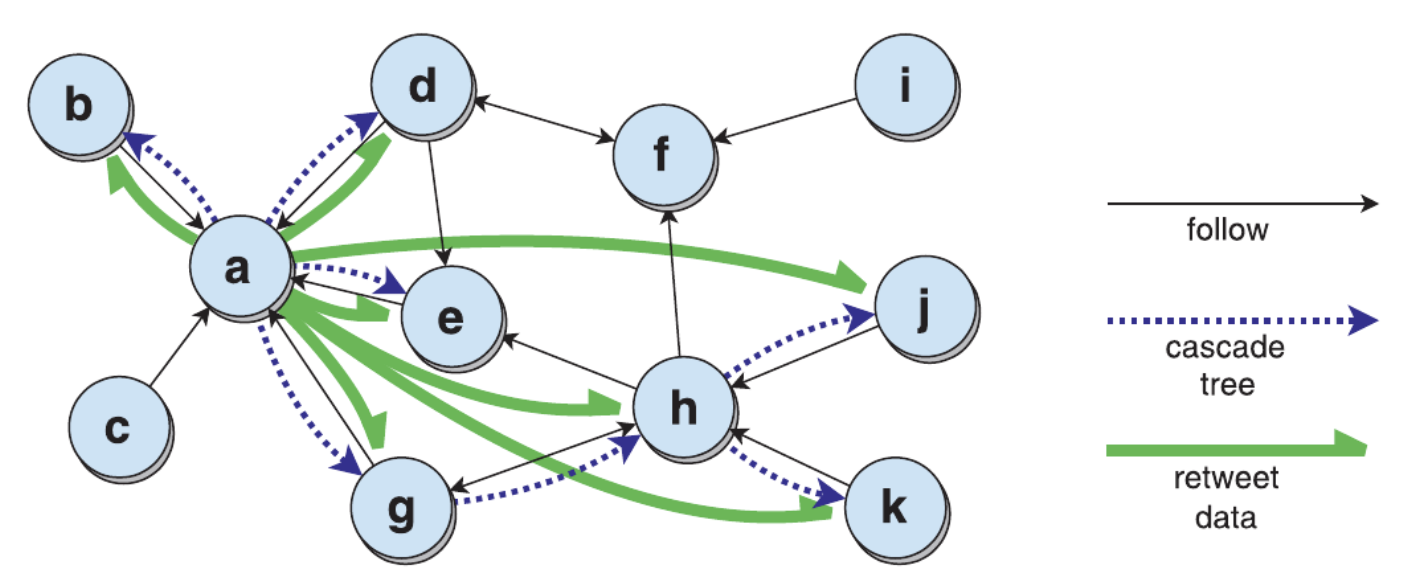
- The same meme can generate many cascade trees (stars).
- Multiple users can share the same link to a news article, or tweet using the same hashtag.
- All star trees for a given meme create a forest (set of trees) that we call the diffusion network. In building a diffusion network, one must first formulate the meme, or memes, whose spread we want to analyze. We might be interested in a single hashtag, say #elections or #soccer; or in all links to articles from a news source or a set of news sources. For instance, when investigating online misinformation, we may wish to track stories from low-credibility sources that routinely spread fabricated news, hoaxes, conspiracy theories, hyper-partisan content, click bait, or junk science. *
Co-occurrence Networks
- Arise from relationships between different types of entities.
Example: Citation networks
- Directed Network:
- Each link has a source and a target node.
- Source nodes and target nodes can be separated, with duplicates if necessary.
- Citation Network Example:
- Source: Citing paper.
- Target: Cited paper.
- Constructing New Networks:
- Co-citation Network:
- Two papers are co-cited if both are cited by the same paper.
- Link weight: number of papers citing both.
- Co-reference Network:
- Two papers are co-referenced if both cite the same paper.
- Link weight: number of papers cited by both.
- Co-citation Network:
- Characteristics:
- Co-citation and co-reference networks are undirected, weighted networks.
- Useful for finding related sets of publications.
Recall: Bi-Partite networks
- Consists of two distinct sets of nodes.
- Links only exist between nodes from different sets, not within the same set.
- Often visualized by placing each set of nodes on opposite sides.
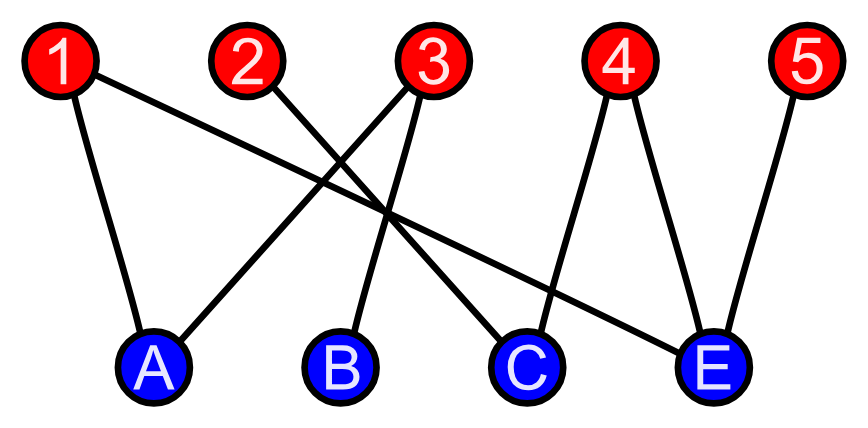
B=nx.complete_bipartite_graph(4,5)
- Common example: collaboration networks (e.g., authors and papers).
- Useful for modeling relationships between two different types of entities.
Example: Bipartite network
A bipartite network induced by “like” relationships.
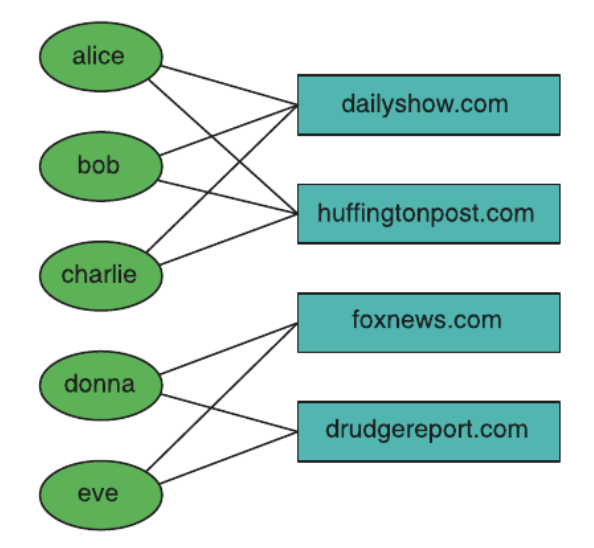
Overview
- Co-occurrence Network:
- Created by projecting bipartite networks.
- Represents two entities of the same type occurring together.
- Links:
- Connect nodes that share a common association.
- Can be weighted by the frequency of co-occurrence.
- Common Examples:
- Students in the same classes.
- Products purchased by the same customers.
- Pages co-liked by Facebook users.
- Applications:
- Used in recommendations.
- Targeted advertising.
- Social Media Context:
- User interactions (likes, shares) create links.
- Aggregated data forms large co-occurrence networks.
Example: co-occurrence network
A user co-occurrence network derived from projecting the “like” network onto user nodes.