Interactivity fundamentals: HTML, CSS, and JavaScript
Interactivity fundamentals
Why interactivity?
Static communication
- A static graphic shows a fixed view of the data.
- Excellent when the message is known in advance.
- The reader sees what the author chose to display.
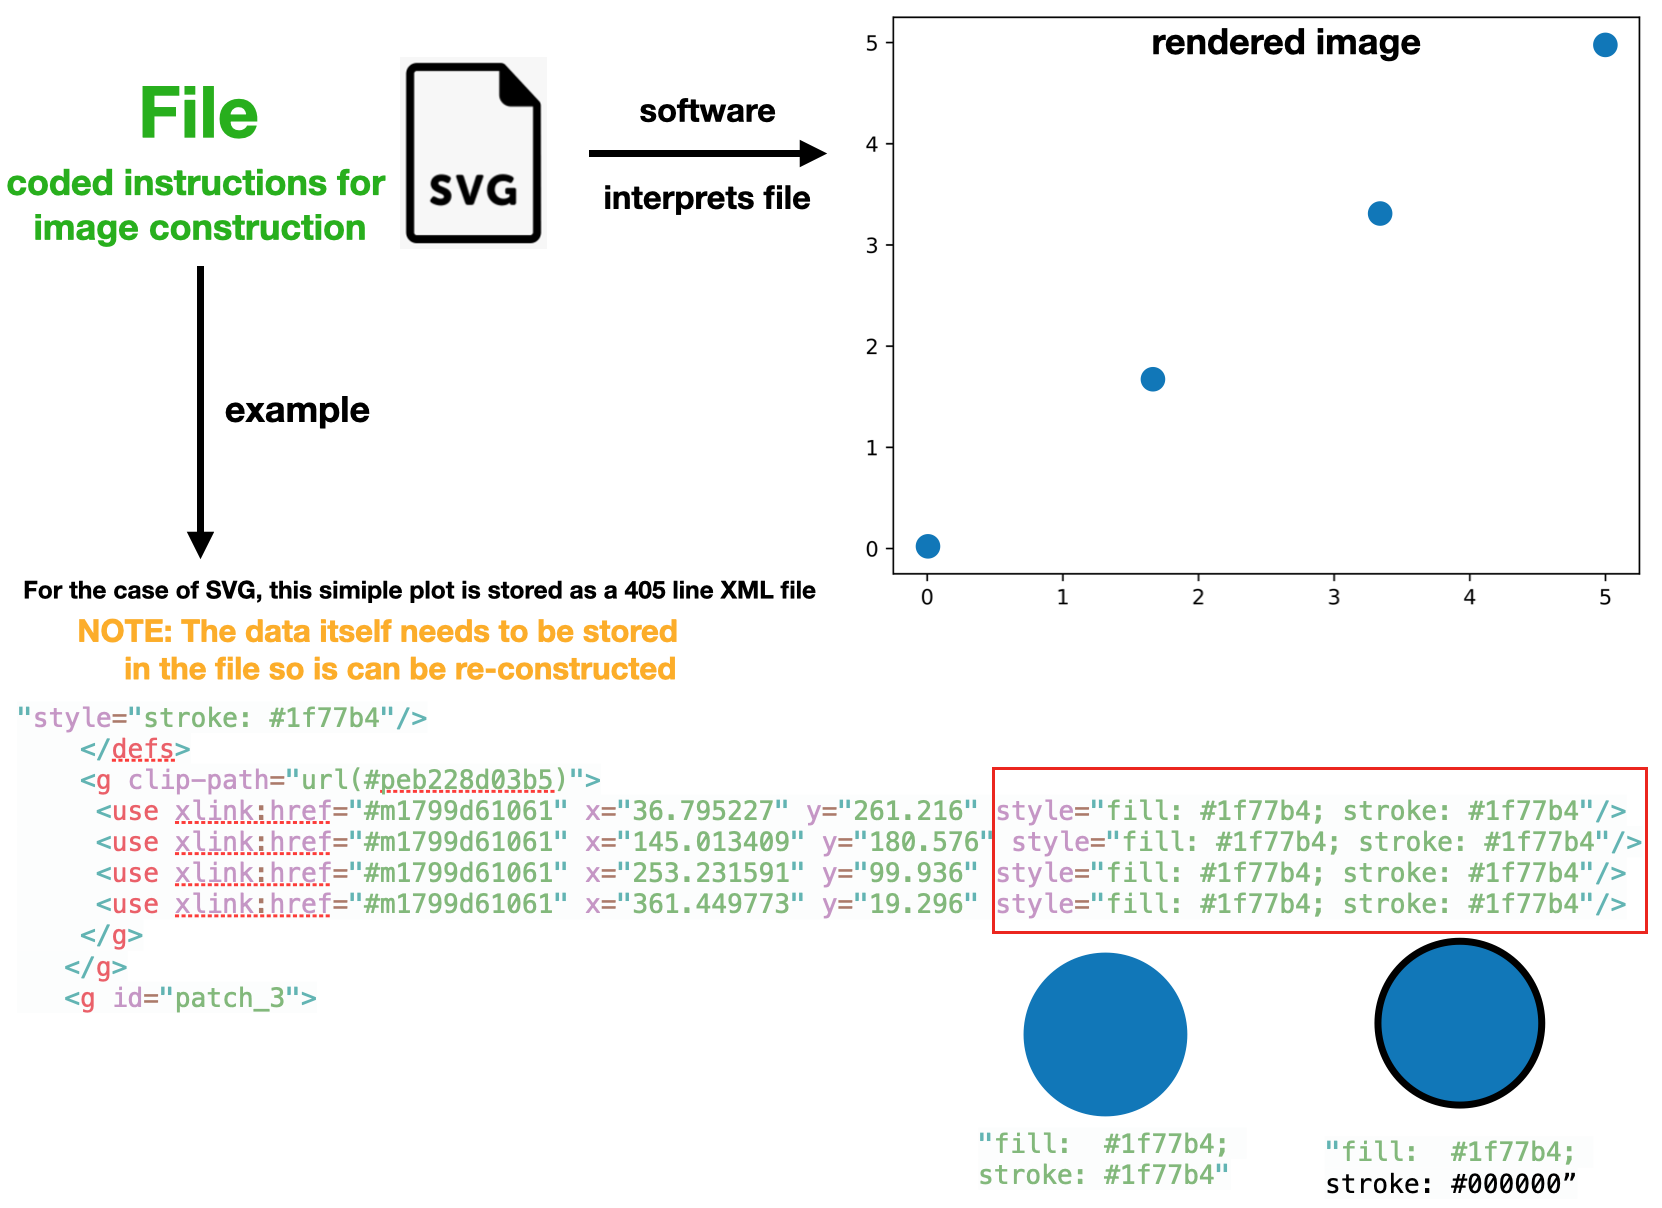
Interactive communication
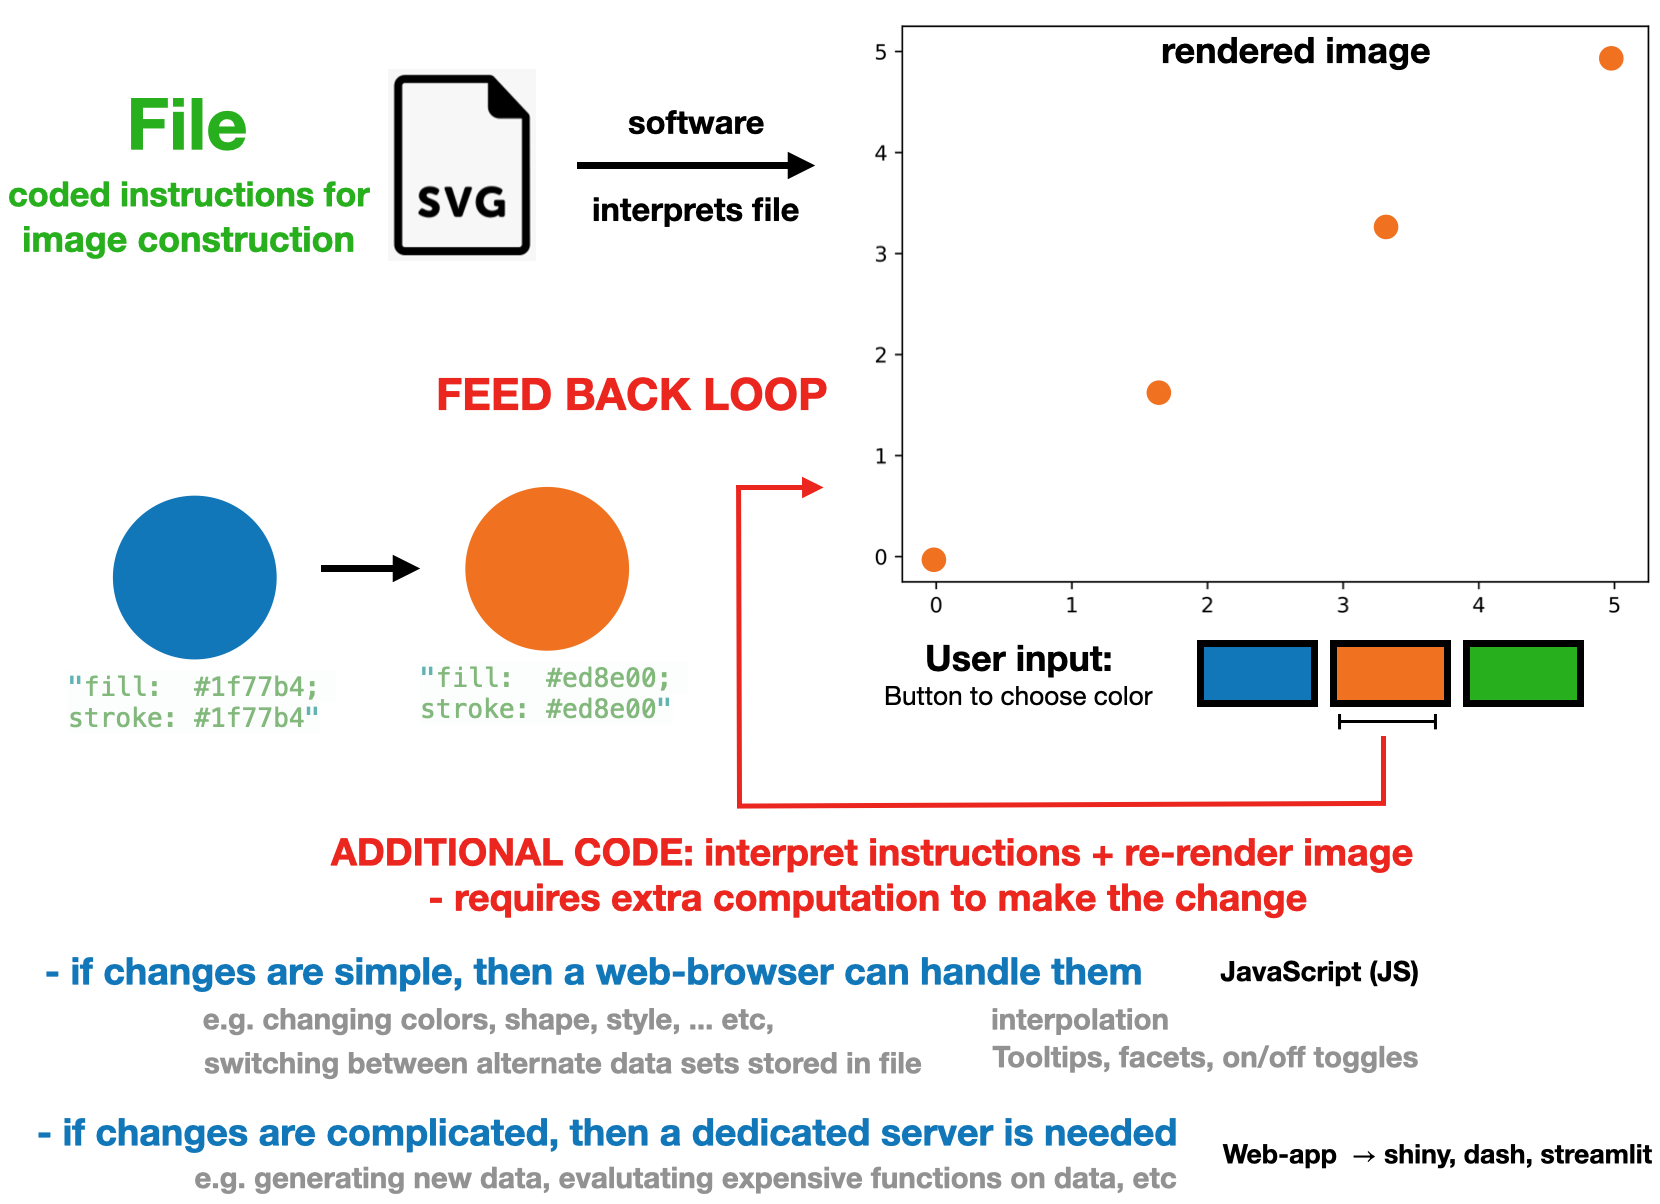
- Users can explore: hover, filter, zoom, select, or animate.
- One graphic can reveal multiple views of a complex dataset.
- Interaction becomes another visual encoding.
The web stack: three jobs
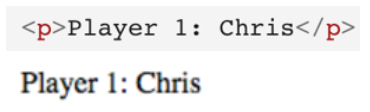
HTML = structure
Defines the content: headings, text, buttons, images, and containers.
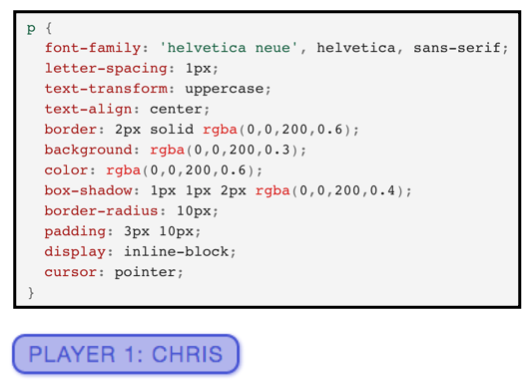
CSS = appearance
Controls presentation: color, typography, spacing, and layout.
JavaScript = behavior
Responds to events and changes the page programmatically.
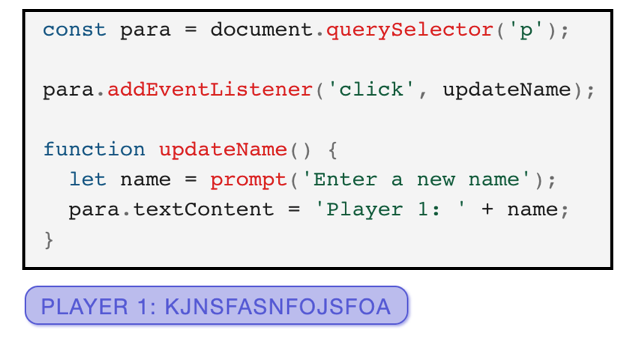
For interactive visualization: HTML provides a place for the chart, CSS styles it, and JavaScript creates and updates it.
What happens in the browser?
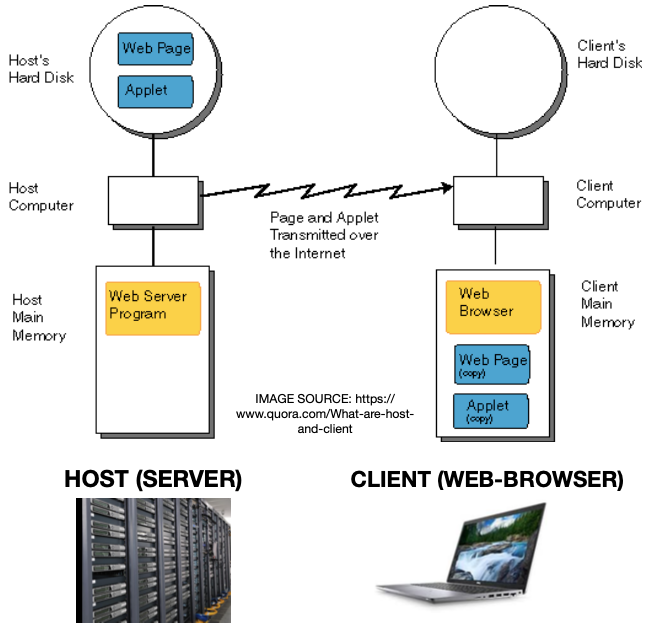
- The browser requests HTML, CSS, JavaScript, data, and other assets.
- It turns the HTML into a structured representation of the page.
- CSS determines how that structure looks.
- JavaScript can react to user actions and modify the page while it is open.
Key idea: interactive charts are small programs running in or alongside a webpage.
HTML, CSS, and the DOM
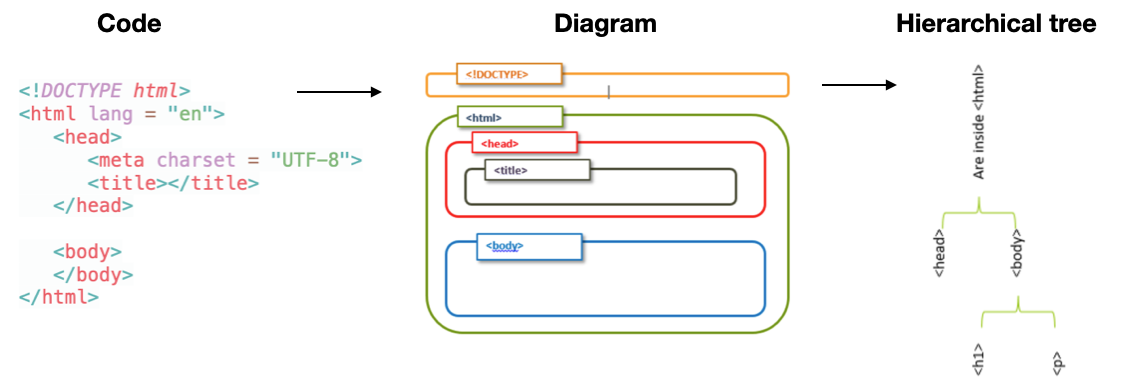
HTML: a hierarchy of elements
<body>
  <h2>Sales dashboard</h2>
  <p id="status">Choose a region.</p>
  <div id="chart"></div>
</body>- HTML is built from elements such as headings, paragraphs, buttons, and
<div>containers. - Elements can have attributes such as
idandclass. - Elements are nested, so the page naturally forms a tree.
CSS: style without changing structure
#chart {
  width: 700px;
  height: 420px;
}

.highlight {
  color: steelblue;
  font-weight: bold;
}- CSS uses selectors to target HTML elements.
- It separates content from presentation.
- Visualization libraries often generate HTML/SVG for us; CSS can still control the surrounding layout and styling.
You do not need to become a web developer: recognize the roles of HTML and CSS so generated interactive graphics are less mysterious.
The DOM: the bridge to interactivity
The Document Object Model (DOM) is the browser’s object representation of the HTML page.
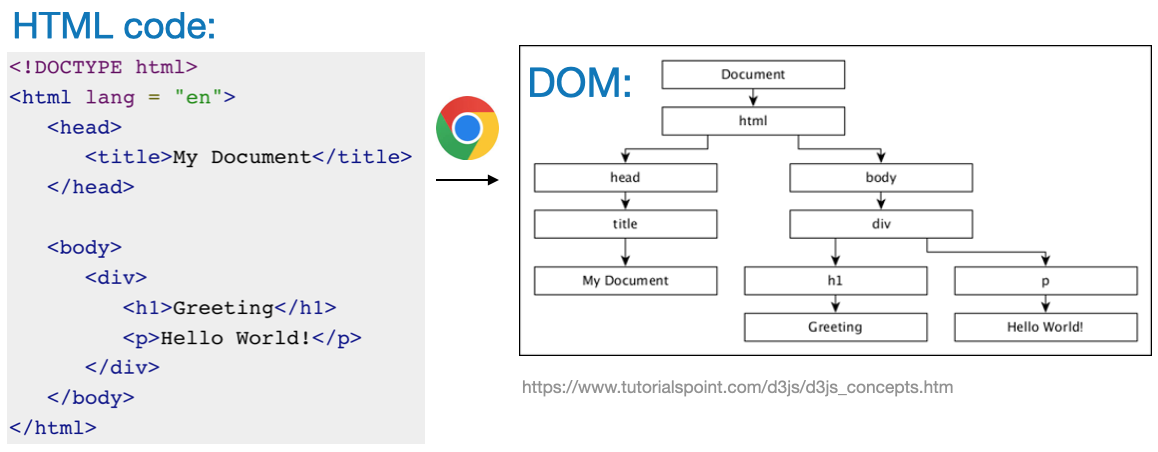
JavaScript can use the DOM to:
- find an element,
- read or change its content,
- add or remove elements,
- respond to events such as clicks or input changes.
Mental model: HTML creates the tree; JavaScript can edit the tree.
SVG: graphics are also elements
- SVG (Scalable Vector Graphics) represents shapes such as circles, lines, rectangles, and text as markup.
- Because SVG elements live in the DOM, JavaScript can change their position, size, color, or visibility.
- This is one reason browser-based visualization can be highly interactive.
<svg width="220" height="100">
  <circle cx="60" cy="50" r="30" fill="steelblue"></circle>
  <rect x="120" y="25" width="70" height="50" fill="orange"></rect>
</svg>
JavaScript: just enough for visualization
What JavaScript contributes
JavaScript is the programming language that makes browser content dynamic.
For data visualization, it commonly handles:
- loading or transforming data,
- responding to clicks, selections, sliders, or hover events,
- changing HTML/SVG elements,
- calling libraries such as Plotly.js or D3.
You mainly need to recognize familiar programming ideas: variables, arrays/objects, functions, loops, and function calls.
A tiny raw JavaScript example
<p id="message">Waiting...</p>
<button onclick="updateMessage()">Click me</button>

<script>
function updateMessage() {
  const element = document.getElementById("message");
  element.textContent = "The page changed without reloading.";
}
</script>
What happened?
- The button fires a click event.
- JavaScript finds an HTML element by its
id. - JavaScript changes that element in the DOM.
This same pattern powers filters, tooltips, linked charts, and dashboards.
Example: a small numerical-integration app
The raw JavaScript can also perform computation based on user input.
function f(x) { return 3*x*x + 4*x; }

function integrate(A, B, N) {
  const dx = (B - A) / N;
  let sum = 0;

  for (let i = 0; i < N; i++) {
    const x = A + (i + 0.5) * dx;   // midpoint
    sum += f(x) * dx;
  }
  return sum;
}

const estimate = integrate(0, 2, 100);
document.getElementById("output").textContent = estimate;
Takeaway: browser JavaScript can combine inputs + computation + DOM updates into an interactive app.
The complete example is included in HTML-JS-D3-examples.zip (INTEGRATE.html).
Visualization libraries
Why use a library?
You could manually create and update every SVG element—but visualization libraries package common patterns for us.
High-level libraries
Examples: Plotly.js, Vega-Lite
- concise chart specifications
- built-in hover, zoom, legends, selections
- fast path to useful interactive graphics
Lower-level libraries
Example: D3.js
- direct control over data-driven DOM/SVG transformations
- extremely flexible
- more code and a steeper learning curve
Choose the highest-level tool that gives you the control you need.
Plotly.js: interactive charts with little code
Plotly.js is a browser-based graphing library that provides many chart types and common interactions out of the box.
<div id="myPlot"></div>
<script src="https://cdn.plot.ly/plotly-2.35.2.min.js"></script>

<script>
const data = [{
  x: [1, 2, 3, 4, 5],
  y: [1, 2, 4, 8, 16],
  mode: "lines+markers",
  type: "scatter"
}];

Plotly.newPlot("myPlot", data);
</script>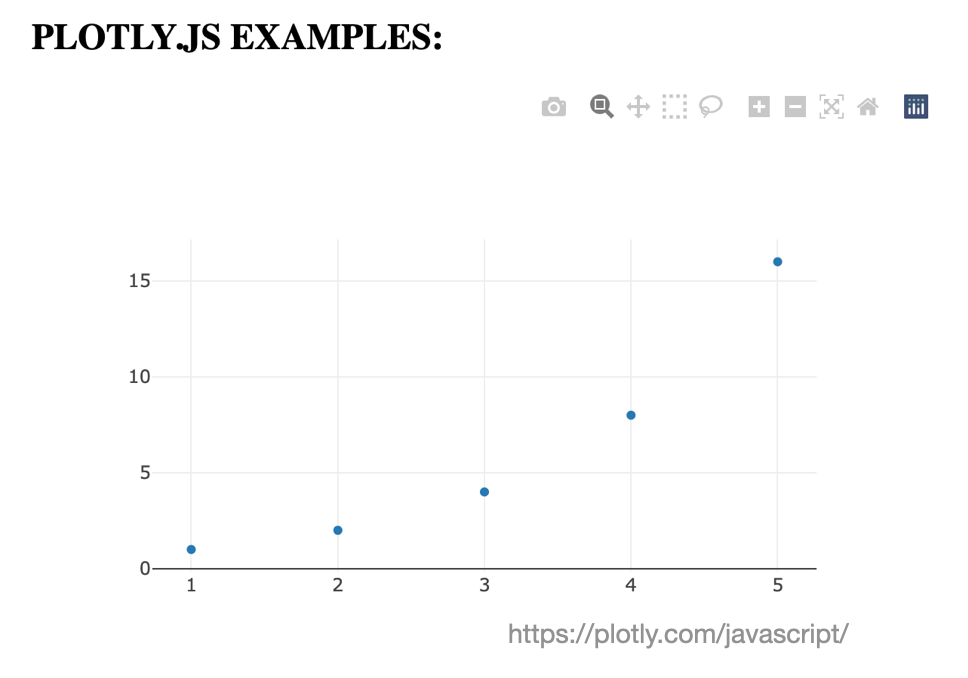
What Plotly.js is doing for us
The code has the same basic ingredients we just learned:
- HTML supplies
<div id="myPlot">— a container for the chart. - JavaScript stores the data and calls
Plotly.newPlot(...). - Plotly.js creates the necessary graphical elements and interaction logic.
- The browser renders the result and handles user events.
This is the motivation for learning the web stack: you can use high-level libraries without treating them as a black box.
D3.js: data-driven control of the DOM
D3 = Data-Driven Documents
- D3 binds data to DOM elements and helps create or update HTML/SVG from that data.
- It provides lower-level building blocks for custom interactive visualizations.
- Many higher-level visualization tools build on similar web concepts.
d3.select("#chart")
  .append("circle")
  .attr("cx", 60)
  .attr("cy", 60)
  .attr("r", 30)
  .style("fill", "steelblue");
For this course, the important point is the model, not memorizing the D3 API.

Common forms of interaction
- Hover: reveal details on demand
- Filter / select: focus on a subset
- Pan / zoom: navigate dense or spatial data
- Linked views: a selection in one chart updates another
- Animation / transitions: show change or guide attention
Interactivity is most useful when it helps the viewer answer a question that would be difficult with one fixed view.
Big picture
DATA
  ↓
JavaScript / visualization library
  ↓
HTML + SVG elements in the DOM
  ↓
CSS + browser rendering
  ↓
INTERACTIVE GRAPHIC
  ↕
user events: hover • click • filter • zoom
Remember the roles:
- HTML → structure
- CSS → appearance
- JavaScript → behavior
- Plotly.js / D3 / other libraries → reusable visualization machinery
You do not need to build everything from scratch—you need enough of the foundation to understand and customize the tools you use.
Optional resources / demo
Explore the included examples
Useful files to inspect after class: - INTEGRATE.html — raw JavaScript + user input + computation - JS-Plotting/ — JavaScript plotting examples - EX-D3/ — progressively more detailed D3/SVG examples - html-cheatsheet.zip — HTML reference material
These are optional extensions, not material you need to memorize for the introductory lecture.