Server-Side Visualization Tools in Python
Streamlit first · Dash as optional supplemental material
- Goal: turn Python analyses into interactive data applications.
- Prerequisites: basic Python, pandas, and plotting.
- Roadmap: web visualization ecosystem → client/server → Streamlit → optional advanced topics.
Lecture 1 of 2: The next packet introduces Shiny in R.
Introduction to Server Side Tools For visualization
Where does a visualization run?
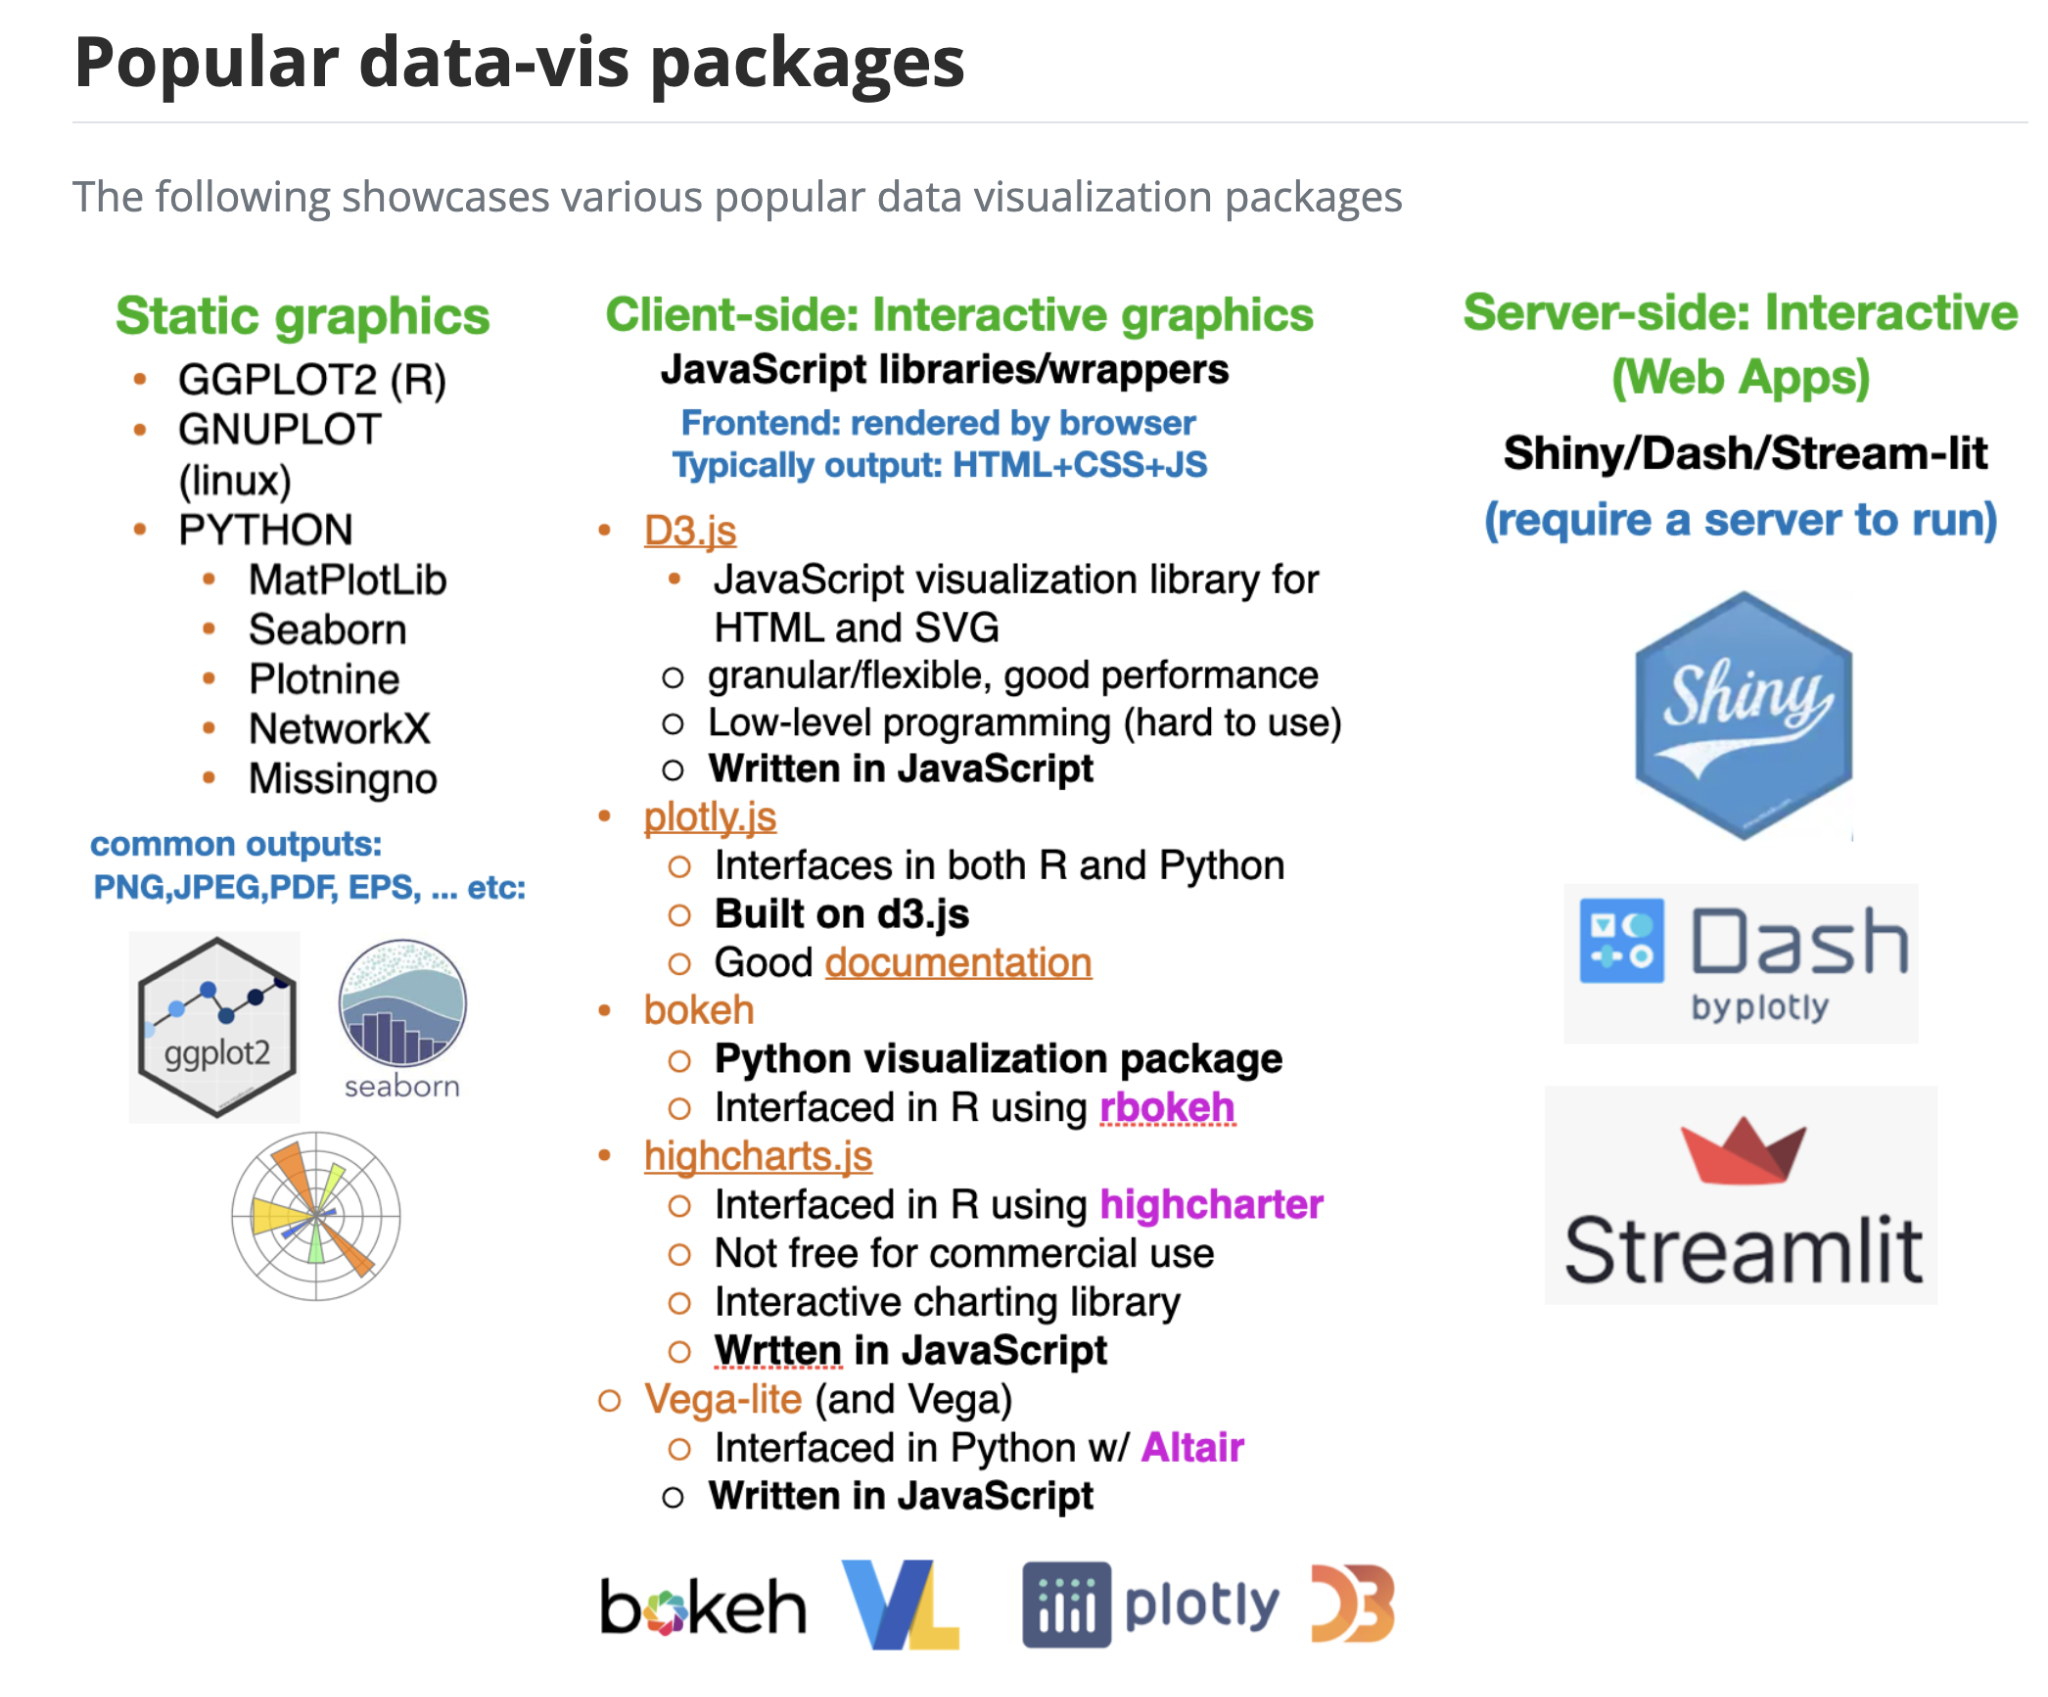
- Static graphic: rendered once; export a PNG, SVG, or PDF (Matplotlib, Seaborn, ggplot2).
- Client-side interactive graphic: browser handles zoom, hover, and selection (Plotly.js, Vega-Lite).
- Server-backed data app: browser controls trigger Python/R calculations, queries, or models (Streamlit, Dash, Shiny).
- These categories overlap: a Streamlit app can display an interactive Plotly chart.
The internet in one picture
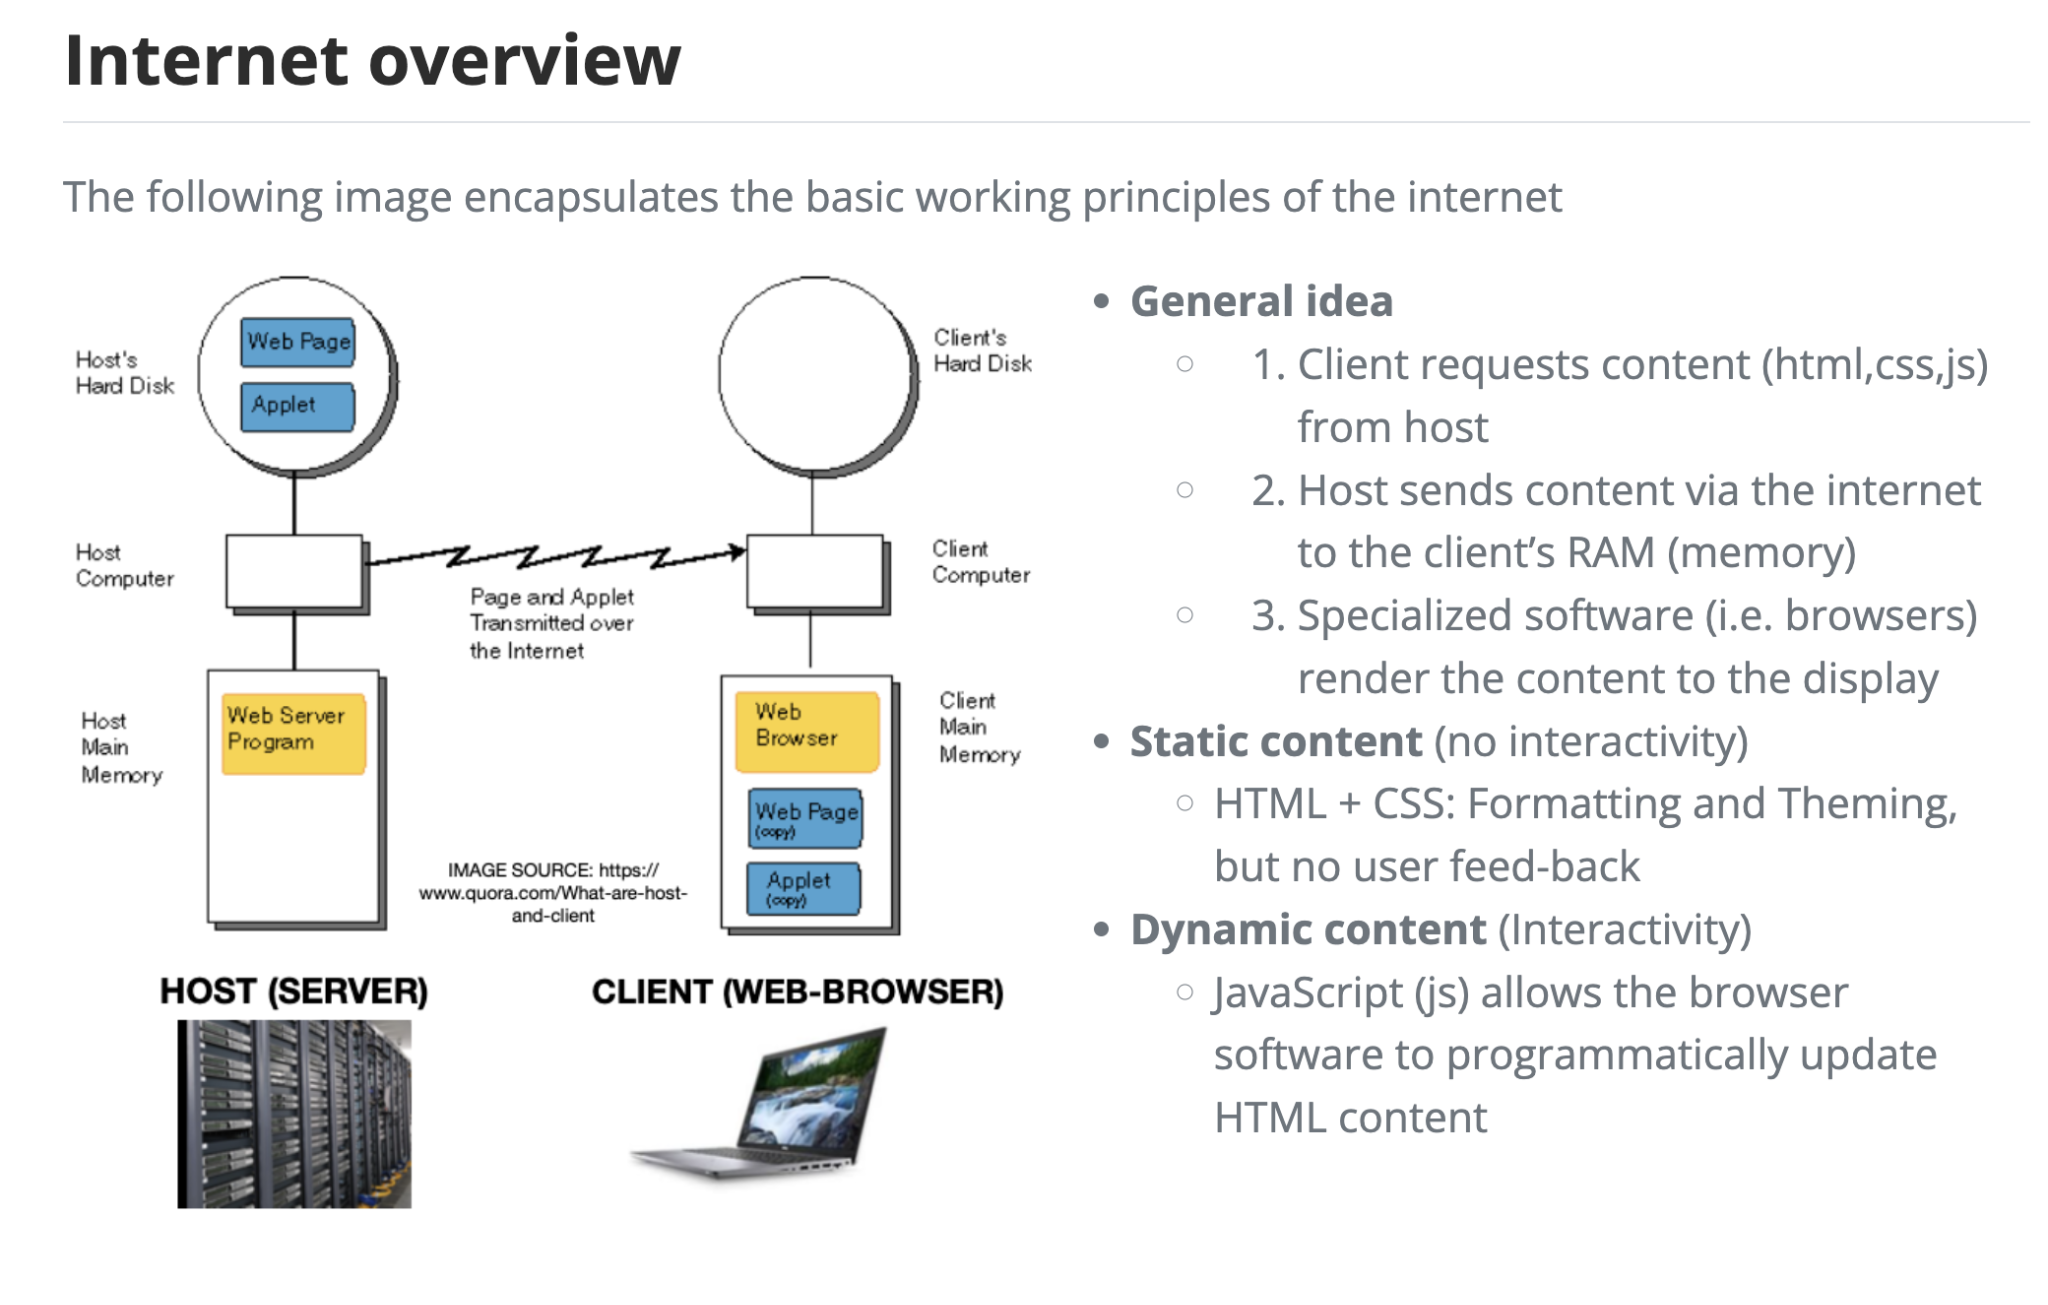
- A browser (client) requests a page from a web server.
- The server returns HTML, CSS, JavaScript, and possibly data.
- The browser displays the page; later interactions may or may not require another server request.
- Historical diagram note: Java applets are obsolete; modern web apps generally use JavaScript and web APIs.
Frontend vs. backend
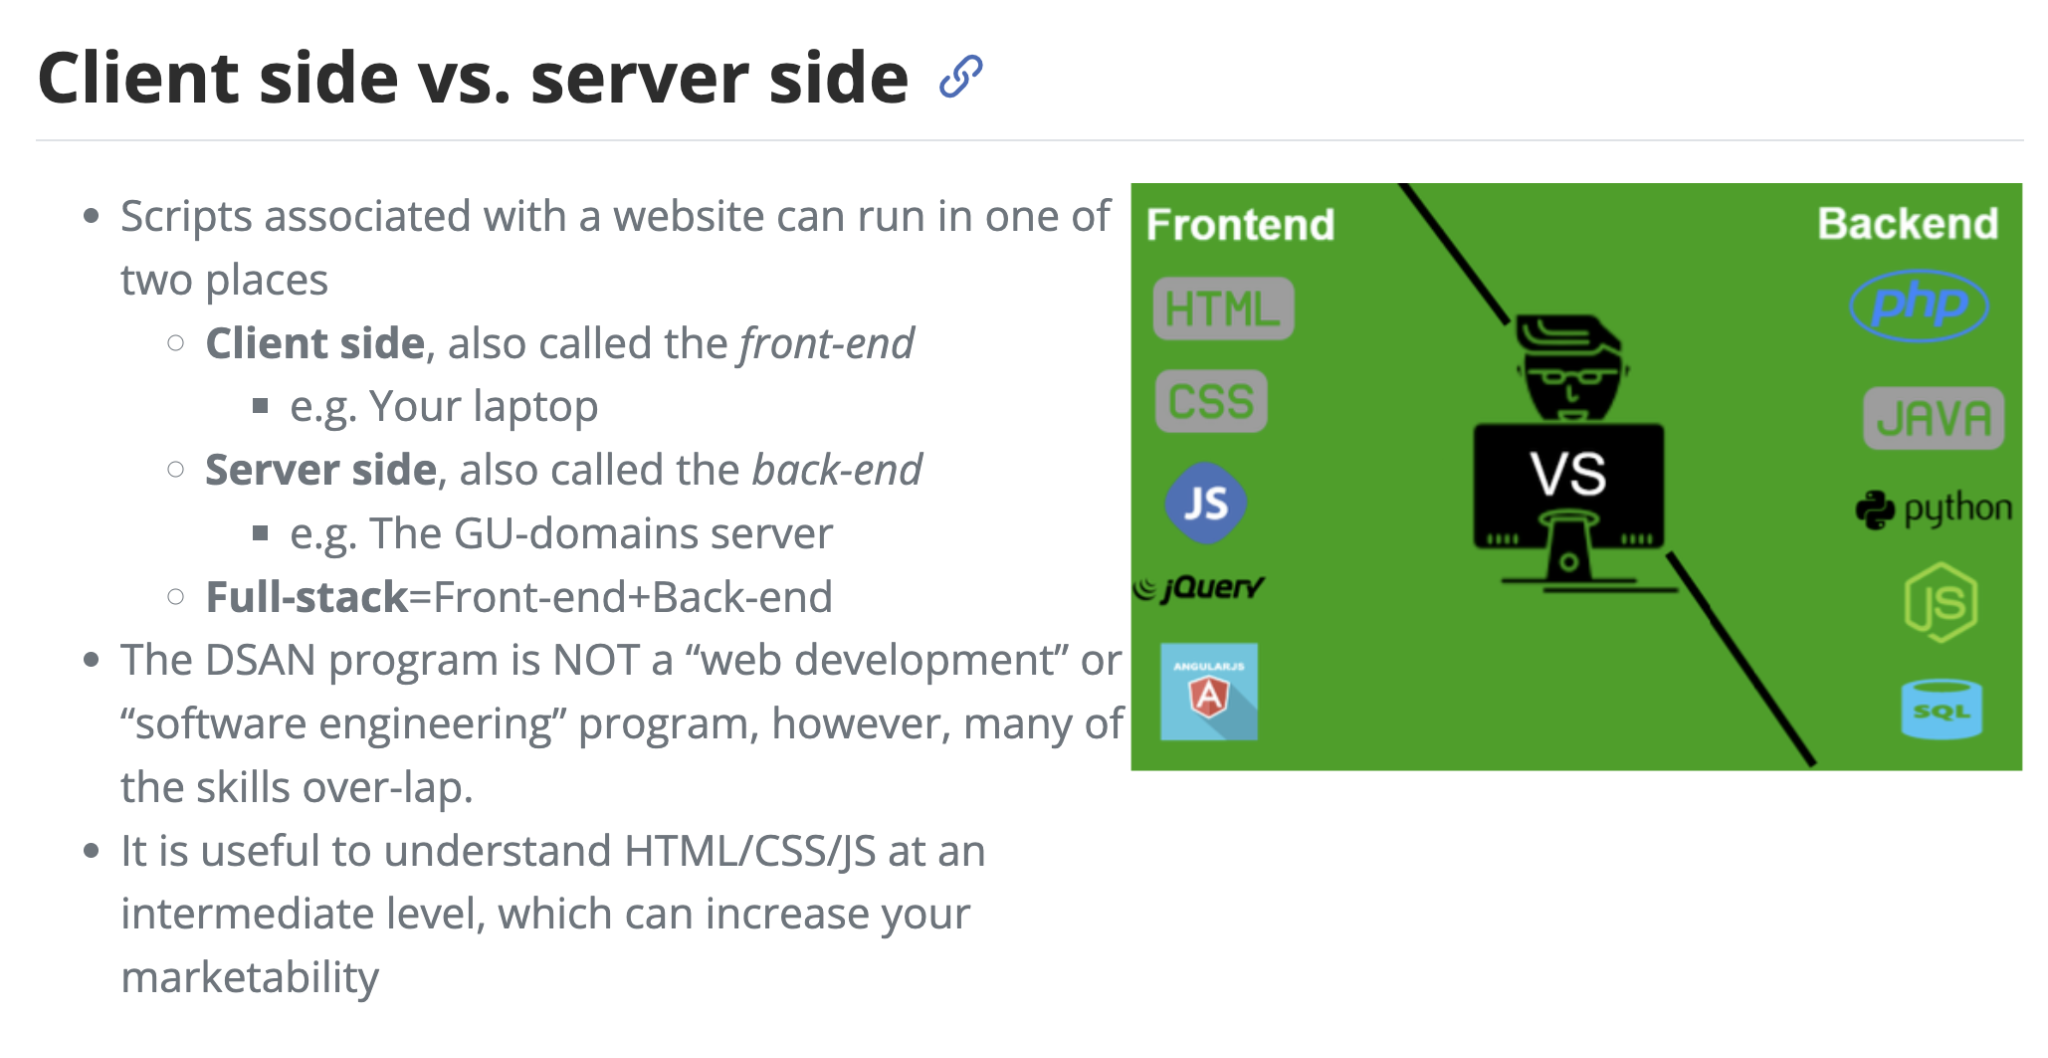
- Frontend (browser): what users see and click; HTML/CSS/JavaScript.
- Backend (server): Python/R code that loads data, runs models, queries databases, and returns results.
- A server can be your own laptop during development—not necessarily a cloud machine.
- Streamlit hides much of the web plumbing, but a server process still runs Python.
Compare: Plotly HTML vs. a Streamlit app
| Question | Standalone Plotly HTML | Streamlit app |
|---|---|---|
| Where does interaction happen? | Mostly in browser | Browser and Python server |
| Hover, zoom, toggle traces? | Yes | Yes (via embedded Plotly chart) |
| Re-run Python after a widget changes? | No | Yes |
| Query a database or score a model on demand? | Not without another service | Yes, from Python |
| Share as a static file? | Often yes | Requires running app server |
Key idea: A Plotly chart can be interactive without a Python backend. A Streamlit app can recompute its data and charts when inputs change.
A concrete example: exploring sales
Client-side-only: A user hovers over a precomputed sales chart or hides a product series.
Server-backed: A user chooses a region → Python filters millions of records (or queries a database) → computes a new forecast → sends updated results to the browser.
- A backend unlocks fresh data, expensive computation, authentication, and coordinated controls.
- Tradeoff: hosting, latency, cost, and security become important.
How a server-backed visualization works
Browser                     Python server
[Choose a region] --------> [Read selection]
                            [Filter / query data]
                            [Compute / fit model]
[Updated chart] <---------- [Return results]- The UI collects inputs and presents outputs.
- The server does work that cannot be packaged as a self-contained HTML chart.
- A browser is still responsible for rendering the final visualization.
Server-side ecosystem: Python and R
| Language | Tools | Typical strengths |
|---|---|---|
| Python | Streamlit | Fast, Python-first analytical apps |
| Python | Dash | Explicit layouts and callback-driven apps |
| Python | Panel, Voilà, Gradio | Notebook/model interfaces and custom apps |
| R | Shiny | Reactive analytical apps with R |
| R | Quarto dashboards + Shiny | Reporting with optional server interactivity |
- Both ecosystems can embed Plotly and other interactive chart libraries.
- BI platforms (Power BI, Tableau) emphasize managed reporting; frameworks emphasize custom behavior and computation.
Hosting: where does the backend live?
- Local: run on your laptop for development; browser connects to
localhost. - Hosted: deploy to an appropriate cloud/app platform so others can open a URL.
- Hosting must keep the Python/R process running and provide required packages and data access.
- Public hosting is not automatically private: avoid committing passwords, tokens, or sensitive datasets.
- Containerization (e.g., Docker) can help package dependencies, but is not needed for our first app.
Agentic coding: another way to build data apps
- AI coding assistants can help plan, generate, run, debug, and revise application code.
- A prompt might be: “Build a Streamlit dashboard that filters a CSV and plots sales by month.”
- This can speed up prototyping and let analysts explore unfamiliar frameworks.
- It does not remove the need to understand data, logic, and deployment.
Working responsibly with AI-generated applications
- Start with a clear specification: dataset, inputs, expected outputs, and audience.
- Run locally; inspect the code; verify chart values against known examples.
- Check dependencies, secrets, data permissions, and error handling.
- Ask the assistant to explain each component and simplify unfamiliar code.
- Takeaway: AI is a collaborator, not a substitute for validation. We may revisit full app-building workflows later in the course.
Introduction to Streamlit
What is Streamlit?
- Streamlit is an open-source Python framework for making interactive data applications.
- Write ordinary Python scripts with functions such as
st.title(),st.slider(), andst.plotly_chart(). - Streamlit supplies the browser interface and runs your Python code on a server.
- Great for prototypes, course projects, exploratory dashboards, and model demos.
Mental model: write a Python script that describes the page.
Install and launch
From a terminal in your project directory:
python -m pip install streamlit pandas plotlyCreate a file called app.py. Run:
streamlit run app.py- Open the local URL printed in the terminal (typically
http://localhost:8501). - Save edits to
app.py; Streamlit can rerun the app. - Important: Run a Streamlit app from a terminal—not as a normal Jupyter code cell.
First app: text and a table
Save this as app.py:
import streamlit as st
import pandas as pd

st.title("My first data app")
st.write("Explore a tiny dataset with Python.")

data = pd.DataFrame({"month": ["Jan", "Feb", "Mar"],
                     "sales": [120, 150, 135]})
st.dataframe(data)st.title()creates a heading.st.write()displays text or many Python objects.st.dataframe()provides a scrollable, interactive table.
Add a widget: the slider
import streamlit as st

st.title("Interactive input")
minimum_sales = st.slider("Minimum sales", 0, 200, 100)
st.write("Selected threshold:", minimum_sales)st.slider()returns the user’s chosen value.- Changing a widget typically reruns the Python script from top to bottom.
- The widget’s current value is available on each rerun.
Connect an input to a visualization
import pandas as pd
import plotly.express as px
import streamlit as st

sales = pd.DataFrame({
    "month": ["Jan", "Feb", "Mar", "Apr"],
    "sales": [120, 150, 135, 180],
})
threshold = st.slider("Minimum sales", 0, 200, 100)
filtered = sales[sales["sales"] >= threshold]

fig = px.bar(filtered, x="month", y="sales", title="Monthly sales")
st.plotly_chart(fig, use_container_width=True)
Notice: Python filters the data; Plotly handles chart interactions in the browser.
A complete small dashboard
import pandas as pd
import plotly.express as px
import streamlit as st

st.title("Sales explorer")
df = pd.DataFrame({"region": ["East", "East", "West", "West"],
                   "month": ["Jan", "Feb", "Jan", "Feb"],
                   "sales": [120, 160, 90, 140]})
region = st.selectbox("Region", sorted(df["region"].unique()))
view = df[df["region"] == region]
st.metric("Total sales", f"${view['sales'].sum():,.0f}")
st.plotly_chart(px.bar(view, x="month", y="sales"),
                use_container_width=True)
st.dataframe(view)- One selection drives a metric, chart, and table.
- This is a server-backed dashboard, even though its dataset is small.
Layout: organize a dashboard
import streamlit as st

st.set_page_config(page_title="Explorer", layout="wide")
st.title("Explorer")

with st.sidebar:
    year = st.selectbox("Year", [2024, 2025, 2026])

left, right = st.columns(2)
with left:
    st.metric("Selected year", year)
with right:
st.info("Place a chart or table here.")- Sidebar: controls that affect the whole page.
- Columns: place related outputs side by side.
st.set_page_config()belongs near the beginning of the script.
Loading your own data
import pandas as pd
import streamlit as st

uploaded = st.file_uploader("Choose a CSV", type="csv")
if uploaded is not None:
    df = pd.read_csv(uploaded)
    st.write("Rows:", len(df))
    st.dataframe(df.head())
else:
st.info("Upload a CSV to begin.")- Files are supplied by the user through the browser.
- Validate file types, column names, and missing values before plotting.
- Do not assume that a shared app’s uploads are appropriate for sensitive data.
Streamlit’s rerun model
- The script normally runs top to bottom when a user changes a widget.
- Widget values are re-created from the current browser session.
- This makes small apps simple, but repeated data loading can be slow.
- Ask: Which operations should happen on every interaction?
Build a useful app: checklist
- Identify the question the dashboard should answer.
- Load and validate the dataset.
- Add one meaningful control (region, year, category).
- Compute a filtered view in Python.
- Display a chart and a summary metric.
- Test extreme selections and empty results.
- Share the app only after checking its data and access permissions.
Knowledge check
- If you export a Plotly figure to HTML, does it require a running Python server to hover and zoom?
- What changes when a Streamlit slider is moved?
- Why might a server-backed dashboard be more powerful than a static HTML report?
- What additional responsibility appears when an app is deployed publicly?
Going Deeper with Streamlit (Optional)
Cache expensive work
import pandas as pd
import streamlit as st

@st.cache_data
def load_data(path):
    return pd.read_csv(path)

df = load_data("sales.csv")
st.dataframe(df.head())st.cache_datais for reusable data results; cache entries can be shared across sessions.- Use
st.cache_resourcefor reusable resources such as model objects or connections. - Choose caching carefully when data changes or contains user-specific information.
Remember values across reruns
import streamlit as st

if "clicks" not in st.session_state:
    st.session_state.clicks = 0

if st.button("Count a click"):
    st.session_state.clicks += 1

st.write("Clicks in this session:", st.session_state.clicks)st.session_stateretains values for a user session across reruns.- Forms, tabs, multipage navigation, and callbacks offer additional control.
Deployment and reproducibility
- Keep
app.pyand a dependency file (such asrequirements.txt) together. - Test locally from a clean environment before publishing.
- Use a Streamlit-compatible hosting service or your own server/container.
- Store secrets using platform-supported secret management—not in Git.
- Check server logs, package versions, data access, and user permissions.
Optional Supplemental Material: Dash
Where Dash fits
- Dash is a Python framework from Plotly for interactive web applications.
- Uses explicit layout components and callbacks to connect inputs to outputs.
- Often useful when you want more precise control over how UI events update specific outputs.
- Streamlit usually offers a shorter path to a first analytical dashboard.
- Both require a running Python app server for server-side functionality.
Minimal Dash example
Install: python -m pip install dash plotly
from dash import Dash, dcc, html, Input, Output
import plotly.express as px

app = Dash(__name__)
app.layout = html.Div([
    dcc.Slider(1, 5, 1, id="minimum"),
    dcc.Graph(id="chart"),
])

@app.callback(Output("chart", "figure"), Input("minimum", "value"))
def update_chart(minimum):
    df = px.data.iris()
    return px.scatter(df[df.sepal_length >= minimum],
                      x="sepal_width", y="sepal_length",
                      color="species")

if __name__ == "__main__":
    app.run(debug=True)
Run: python app.py. The callback connects slider changes to the figure.
Further reading
Next lecture: Shiny applies the same client/server ideas using R and a reactive programming model.