Tidy data
Introduction
- Tidy data is a framework to structure data in a consistent, analyses-friendly way
- It helps identify ways in which data is not tidy.
- The crucial question for a particular study is: what is a
variableand what is theobservational unit- observational unit (i.e. unit of analysis) –> depends on the question at hand
- Example: Your data consists of hospitalizations across a healthcare network.
- If you’re interested in comparing hospitals, the hospital is the observational unit.
- If you’re interested in readmissions, then the patient is the unit of observation.
- If you’re interested in treatment quality, then hospital visit is the observational unit
- This does not mean that the data set you create or get must be in tidy form.
- Non-tidy structures are often useful for data collection, but are hard for data analyses
- Why do we care about tidy data?: Software tools generally requires it (e.g. Seaborn)
Rules of tidy data
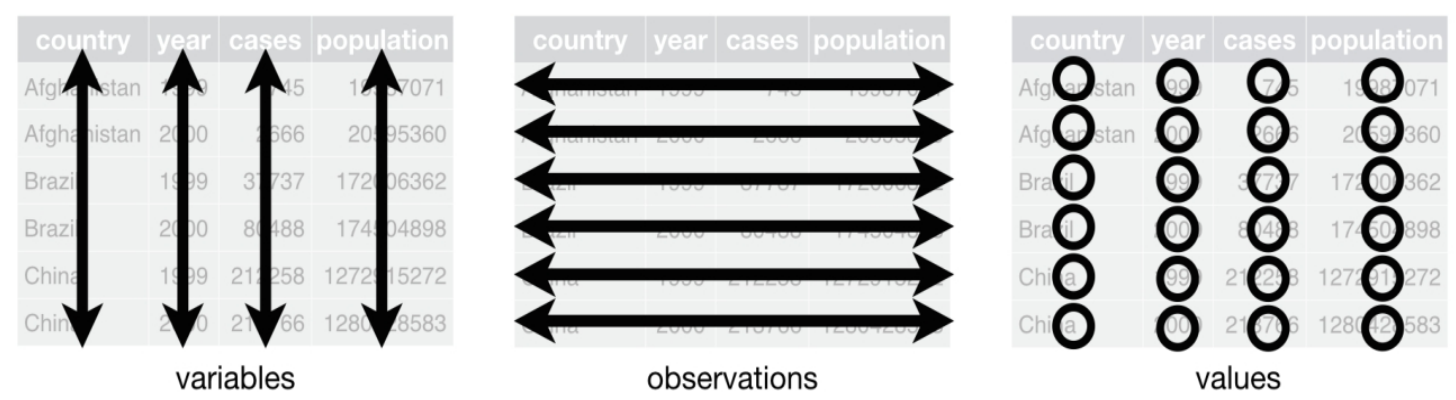
Basic rules of Tidy data:
- Each variable must have its own column
- Each
observationfor a given unit of analysis must have its own row - Each value must have its own cell
- Heirachical data-frames: Each type of observational unit of analysis forms a table
- observational unit “species individuals” \(\rightarrow\) cat & dog data should be in two tables
Image source: R for Data Science (Wickham and Grolemund)
Tidying and cleaning
- Tidying \(\neq\) Cleaning (these two concepts are distinct)
- One should not confuse tidying data with cleaning data.
Tidyingis re-formatting/structuring data so it’s more amenable to computation.Cleaningis fixing mistakes in the actual data.
- Often, for EDA and developing our feel for the data, we iterate between tidying, wrangling/cleaning and visualization
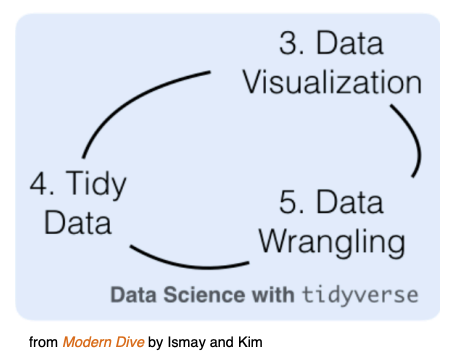
Common forms of Un-Tidy data
Typical problems that need to be tidied.
- Column headers are values, not variable names.
- Multiple variables are stored in one column.
- Variables are stored in both rows and columns.
- Multiple types of observational units are stored in the same table.
- A single observational unit is stored in multiple tables.
Common operations to make data Tidy
- Melting/unpivoting data (addresses data in column names)
- Widening/pivoting data (addresses multiple rows per observation)
- Separating or uniting columns of data (addresses compound columns)
Source: Tidy data: Journal of Statistical Software, Wickham (2014)
Un-tidy data: Example-1
- Problem:
Column headers are values, not variable names- observational unit=
unique instances of vehicles - Each observation for a given unit of analysis DOES NOT have its own row
- observational unit=

- The version on the left is NOT tidy, while the version on the right IS
- The solution in this case is usually
meltingthe data (more on this later) - Clearly you would need to re-structure again if the observational unit changed
Un-tidy data: Example-2
- Problem:
Column headers are values, not variable names- unit of analysis=
income groupNOT religion
- unit of analysis=
- This dataset explores the relationship between income and religion in the US
- This dataset has three variables,
religion,incomeandfrequency
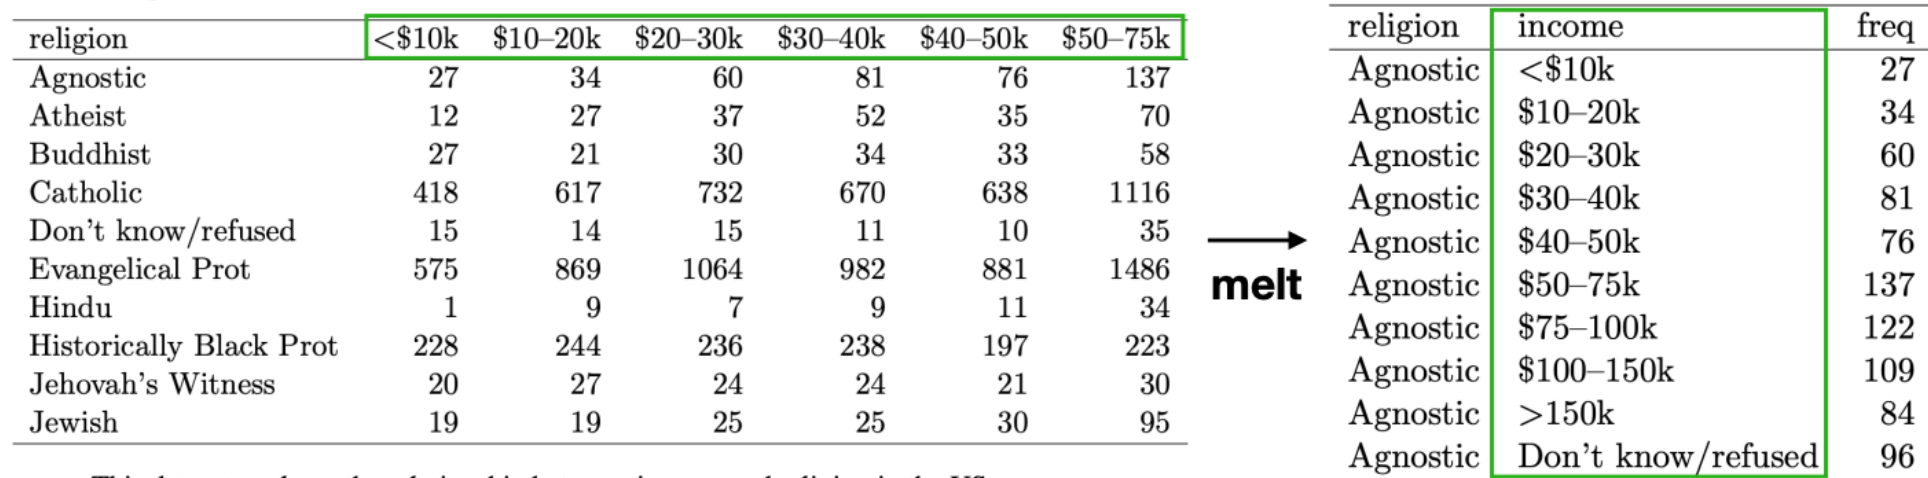
Source: Tidy data: Journal of Statistical Software, Wickham (2014)
Un-tidy data: Example-3
- Problem:
Multiple variables are stored in one column. - Tidying this dataset requires first melting, then splitting the columns in two: sex & age.
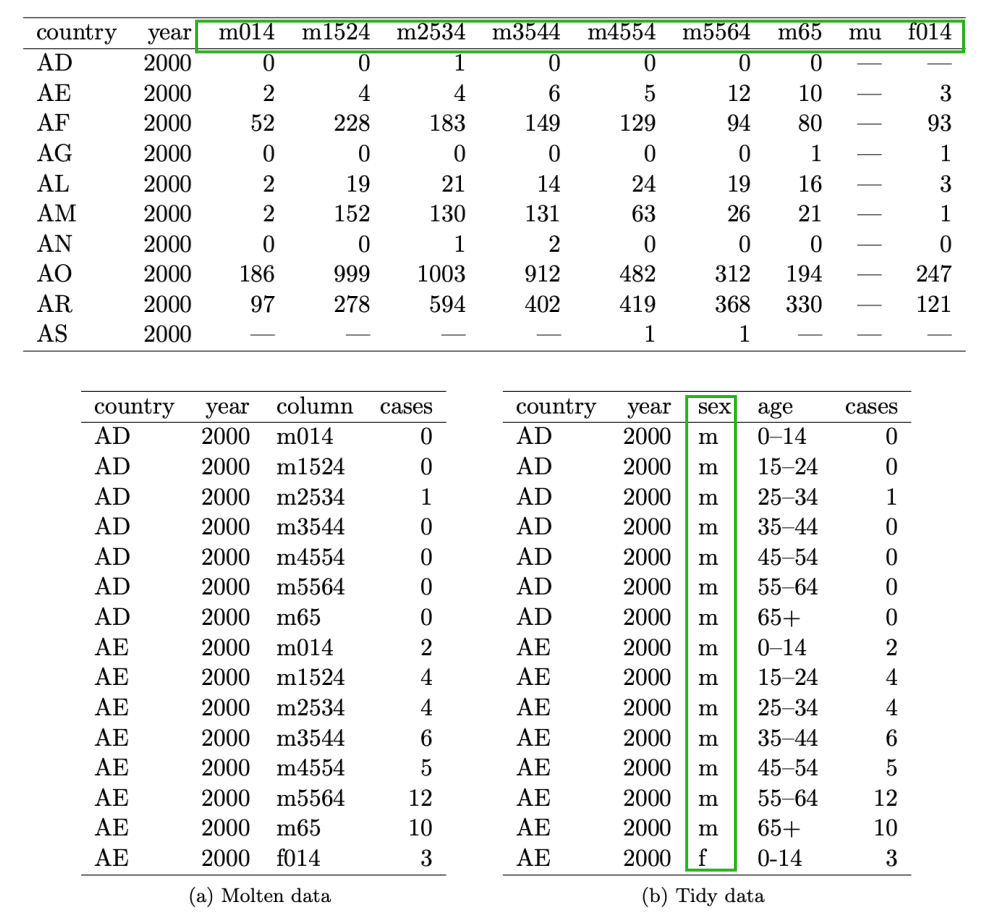
Source: Tidy data: Journal of Statistical Software, Wickham (2014)
Un-tidy data: Example-4
- Problem:
Variables are stored in both rows and columns - Original weather dataset. There is a column for each possible day in the month. Columns \(\mathrm{d} 9\) to \(\mathrm{d} 31\) are omitted to save space.
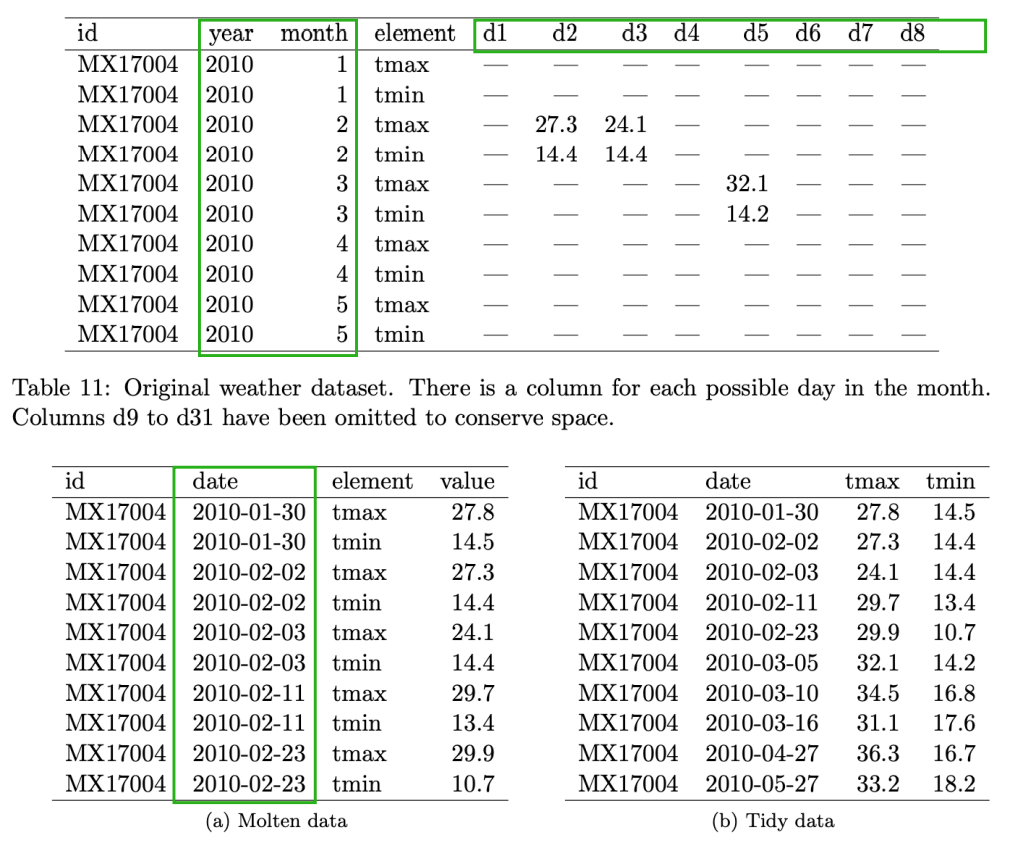
- Molten weather dataset. This is almost tidy, but instead of values, the element column contains names of variables. Missing values are dropped to conserve space.
- Tidy weather dataset. Each row represents the
meteorological measurements for a single day. There are two measured variables, minimum (tmin) and maximum (tmax) temperature; all other variables are fixed.
- Tidy weather dataset. Each row represents the
Source: Tidy data: Journal of Statistical Software, Wickham (2014)
Un-tidy data: Example-5
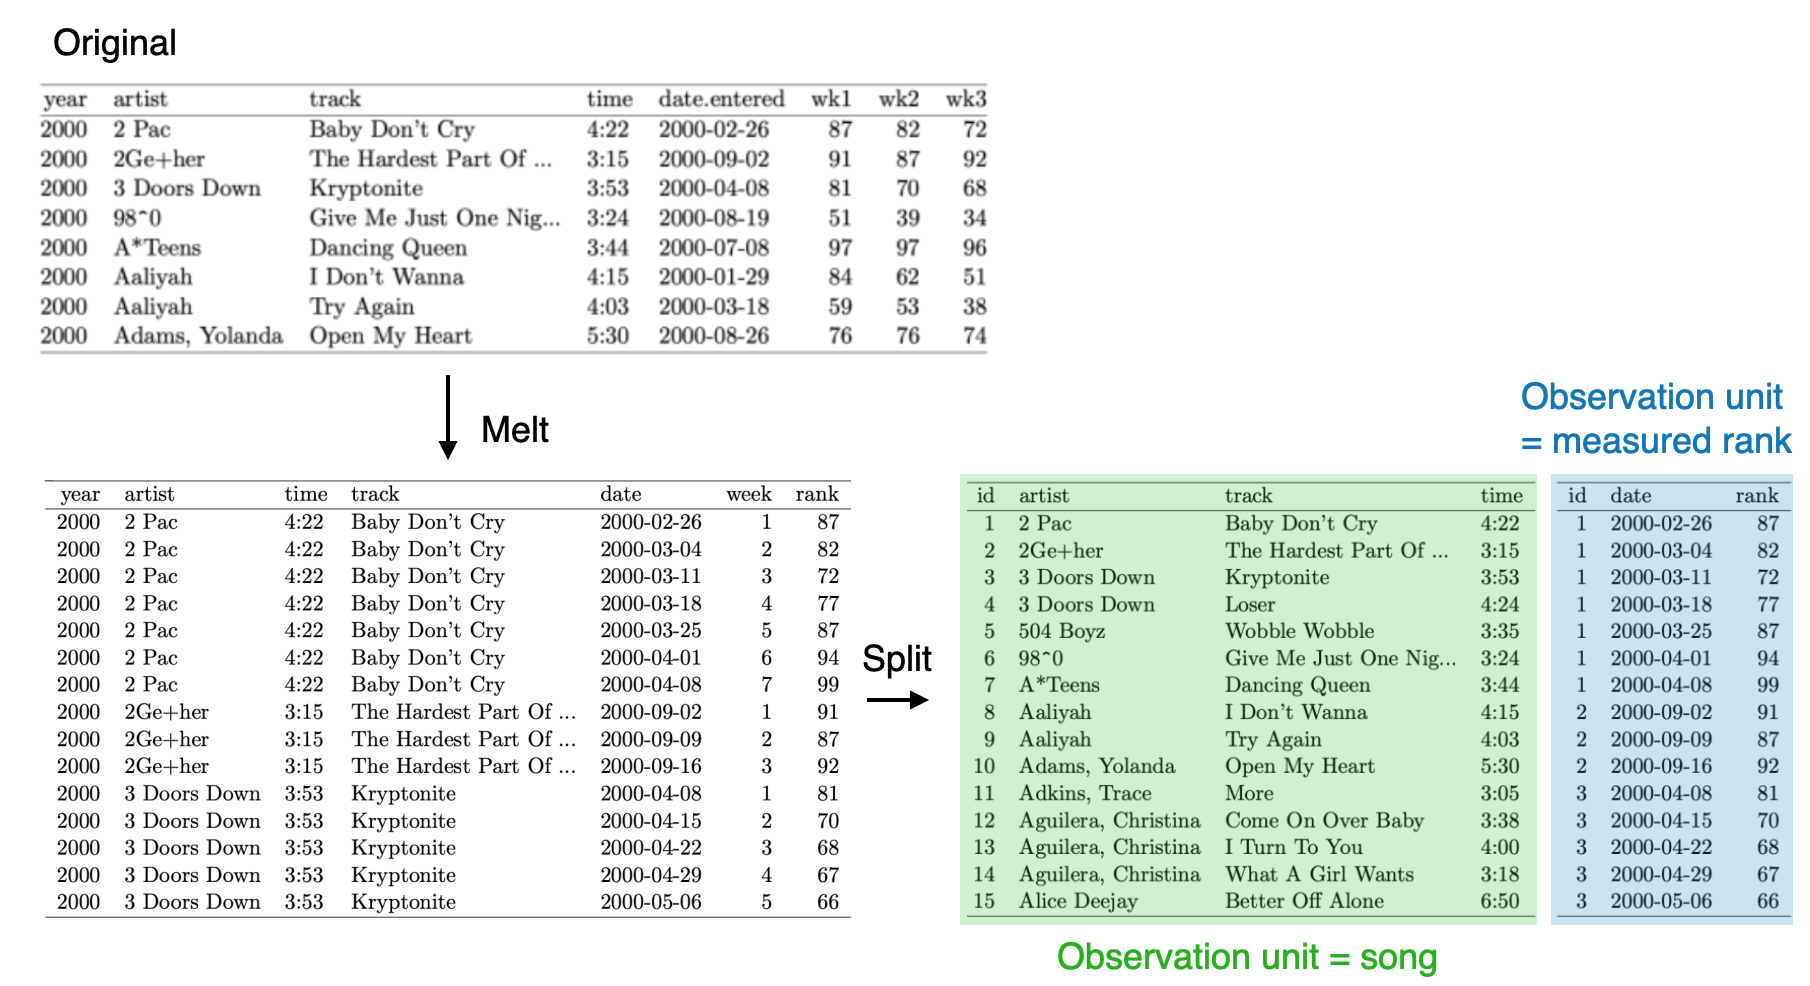
- Problem:
Multiple observational unit types in one table - Datasets often involve values collected at multiple levels, on different types of observational units During tidying, each type of observational unit should be stored in its own table.
- The first eight Billboard top hits for 2000. Other columns not shown are wk4, wk5, \(\ldots\), wk75.
- Normalized Billboard dataset split up into song dataset & rank dataset
Source: Tidy data: Journal of Statistical Software, Wickham (2014)
Recommended reading
- Tidy data: Journal of Statistical Software, Hadley Wickham (2014)
- Hadley Wickham: Developer of ggplot2 and other Tidyverse packages developer