Coding fundamentals
Recording
The following is a recording on this topic, I hope you find it useful!
Feel free to watch at 1.5x or 2x speed.
Note: If you find something missing or incorrect in the recording, then please let me know!
Computer code types
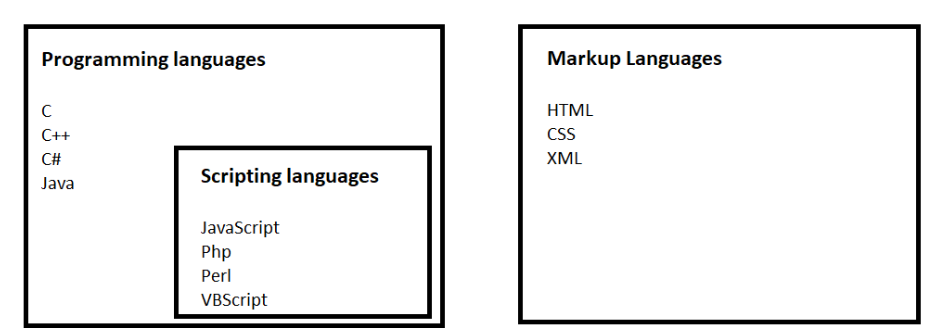
Markup&Mark-downlanguages format & structure content (e.g., .html, .md).Scriptedlanguages are interpreted at runtime (flexible & user-friendly but slower)- Run via an
interpreter: An interpreter is software that reads and executes codeline by line, translating high-level code into machine-readable instructions in real-time, enabling dynamic execution and testing. - Scripted languages in DSAN include
R,Python, andbash(shell script,.sh)
- Run via an
Compiled languages(i.e. programming languages) are translated into machine code before execution, offering performance optimization.- e.g.
C,C++(cpp),Fortran(still very common in hard sciences),Java
- e.g.
Variable scope
- Variable scope refers to where a variable is accessible & can be used within a program. It defines the portion of code where the variable’s value is valid and recognizable.
- Namespace: In computer science, a namespace is a container that holds a set of identifiers (such as variable and function names) to manage organization within a codebase. R uses namespaces to manage variable names, preventing clashes between packages and user-defined variables.
- Global Scope: Variables defined outside of functions are accessible throughout the entire scrip
- Local Scope: Variables defined within a function are typically only accessible within that function
- Encapsulation: Local scope helps prevent unintended variable conflicts & enhances modularity.
IF YOU EVER HAVE WEIRD BUGS IN .ipynb RESTART YOUR KERNEL AND DO “RUN ALL”
Conda
Conda Overview
- Conda is a package & environment manager used in data science & software development, simplifying installation and management of packages & dependencies.
- Easy python package control: seamlessly switch between various python interpreters (conda environments), each with different packages, all on the same machine
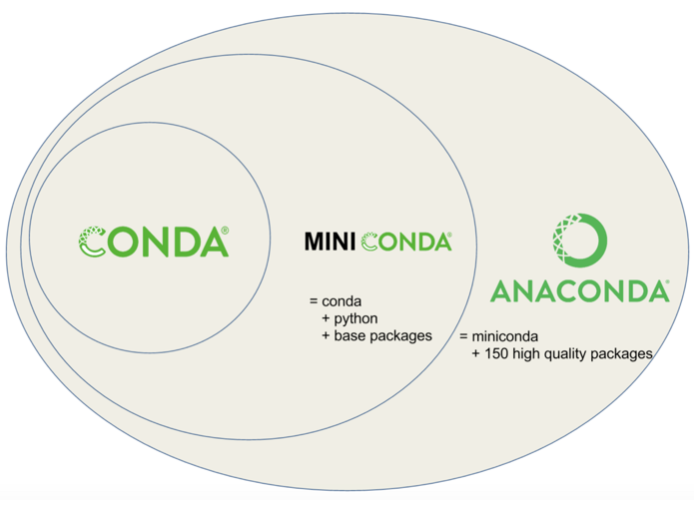
- Enables smooth collaboration in data science, research, and development projects.
Why use conda?
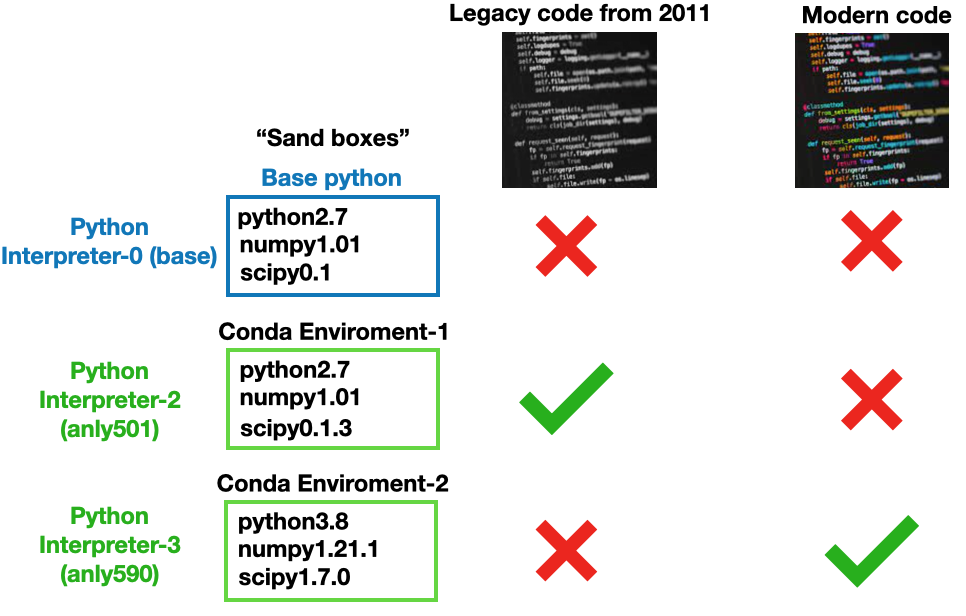
Sandboxingis isolating software applications from the system to prevent potential harm, enabling safe testing and executionCondafacilitates MULTIPLE python interpreters (environments) for various projects
Common Conda commands
- You
DO NOTneed to run these, but they are useful and included as reference - Deactivate current environment
conda deactivate
- Activate environment named “myenv”
conda activate myenv
- To list all of your environments, in your terminal window or an Anaconda Prompt
conda info --envs
- To remove an environment named “myenv”, in terminal or an Anaconda Prompt, run:
conda remove --name myenv --all
- Rename and environment
conda rename -n old_name new_name
Conda cheat-sheet
Source: click here for original PDF 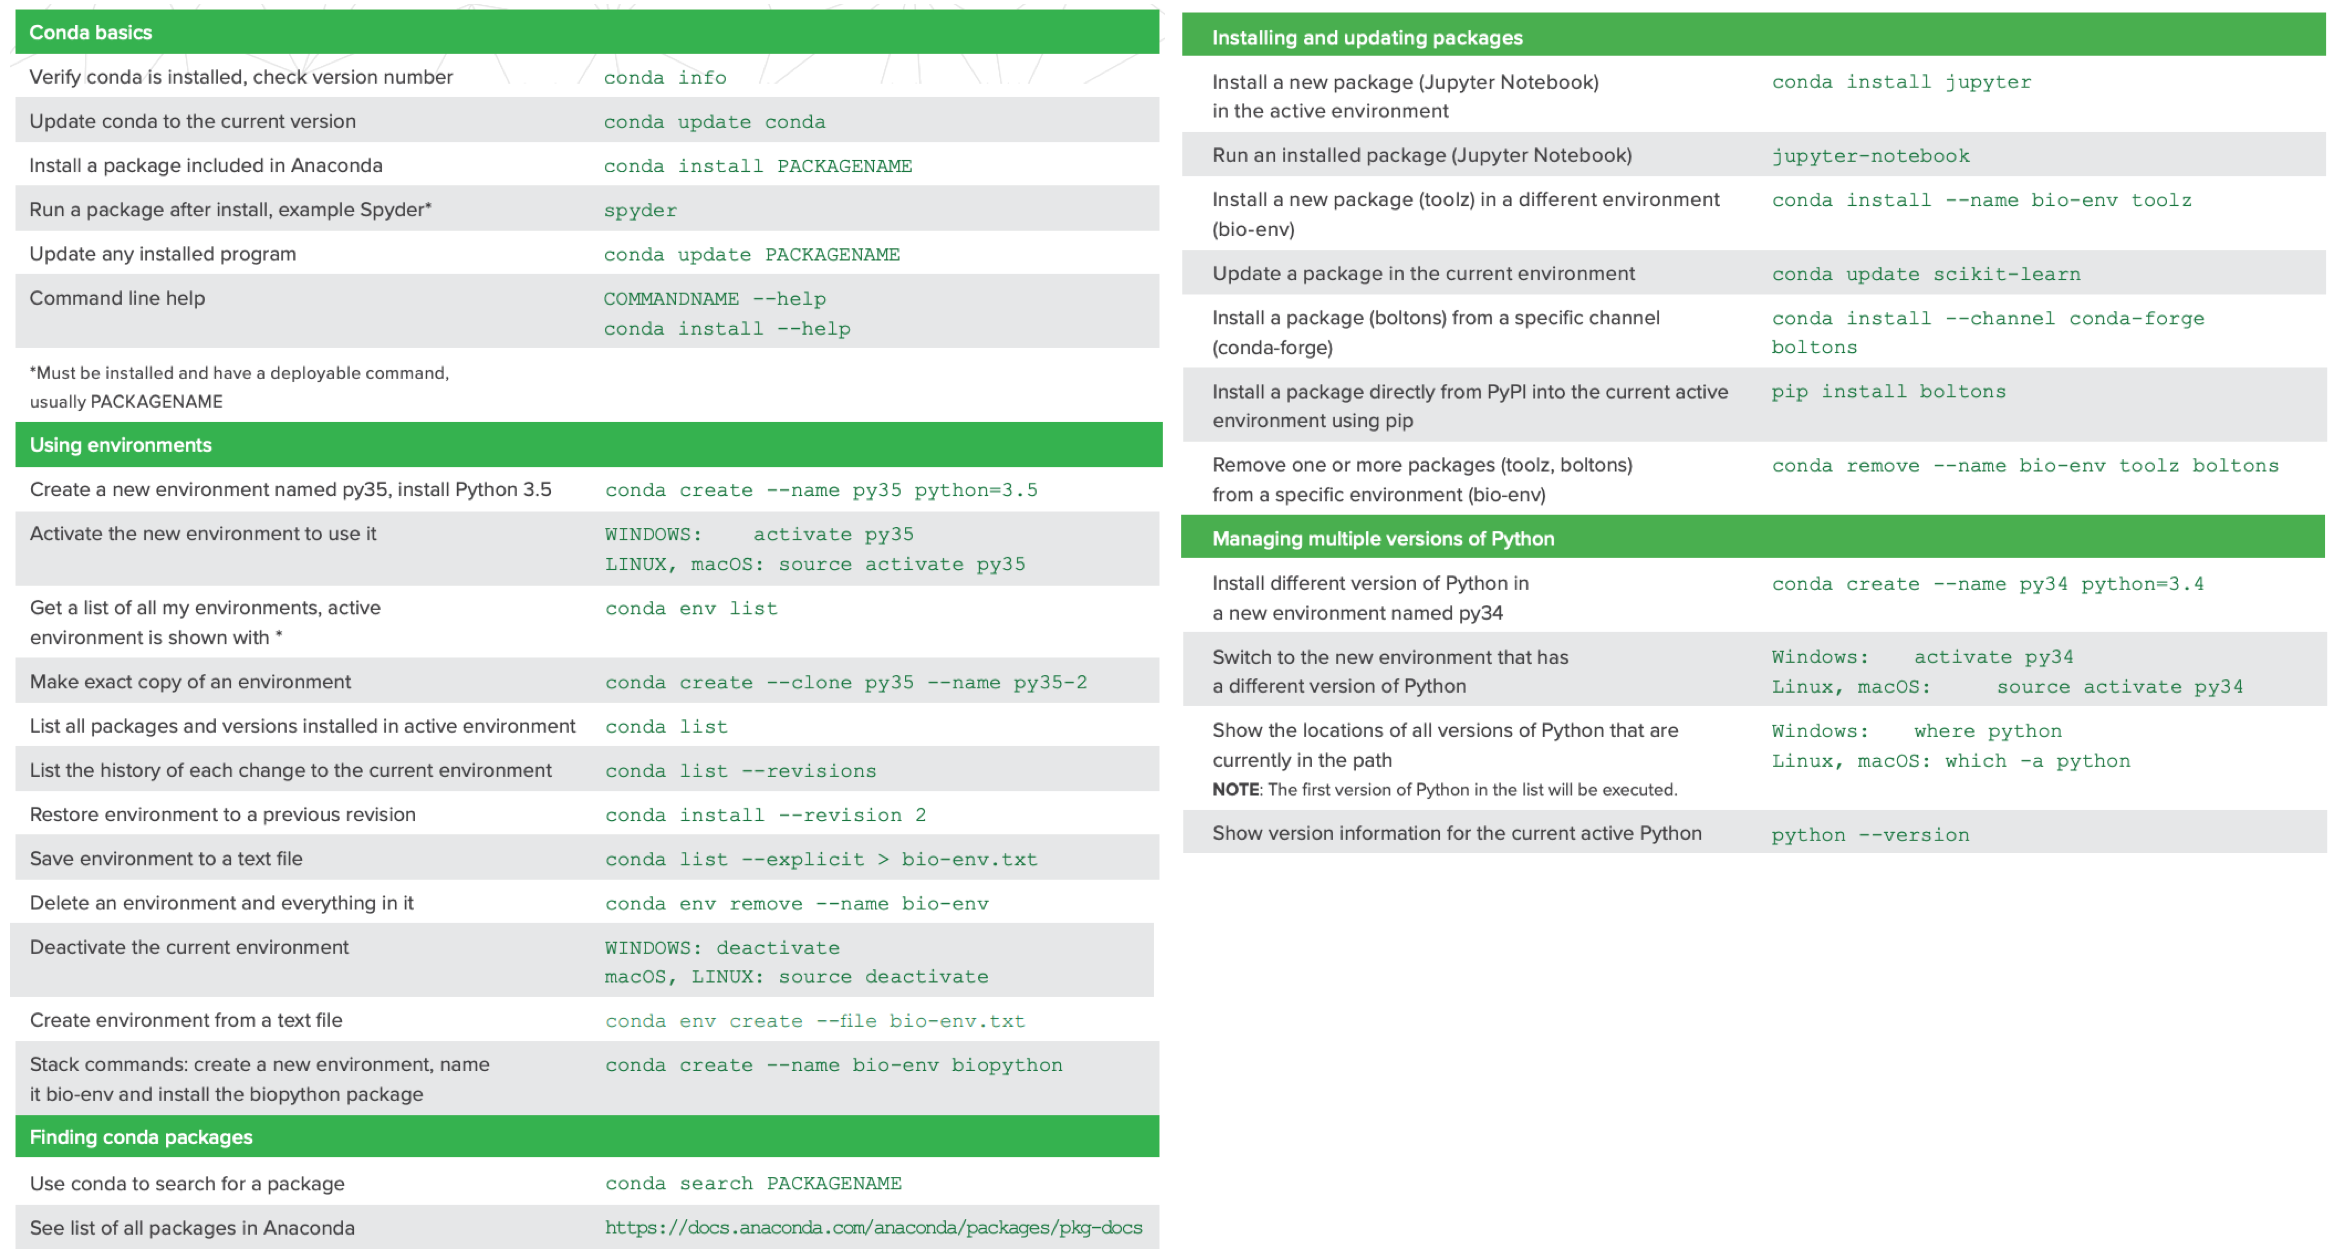
Common coding paradigms
Running scripts
- There are MANY ways to run the scripts that you encounter in data science
.qmd,.rmd, and.ipynbrequire human interaction, e.g. manually running code cells.- They are great for Communication and education but not for automated tasks
.pyand.Rcan be triggered to run automatically.- They are better at “hands-off” automated workflows and complicated software development projects
- Common coding methods
.py\(\rightarrow\) just python code \(\rightarrow\) we can run from terminal withpython filename.py- In this case the
pythoncommand points to a particular python interpreter - Each conda environment is a different interpreter (translator)
- In this case the
.Ror.Rscript\(\rightarrow\) just R code \(\rightarrow\) we can run from terminal run withRscript filename.R- In this case the
Rscriptcommand points to the R interpreter
- In this case the
.rMarkdown=Markdown+R-code\(\rightarrow\) we can run using Rstudio- Rstudio “points” at the same R interpreter used by the
Rscriptcommand
- Rstudio “points” at the same R interpreter used by the
.qmd=Markdown+R or Python code\(\rightarrow\) we can run using Rstudio or VSC.ipynb=Markdown+R or Python code\(\rightarrow\) we can run using Rstudio or VSC- Can select which interpreter to run the code with
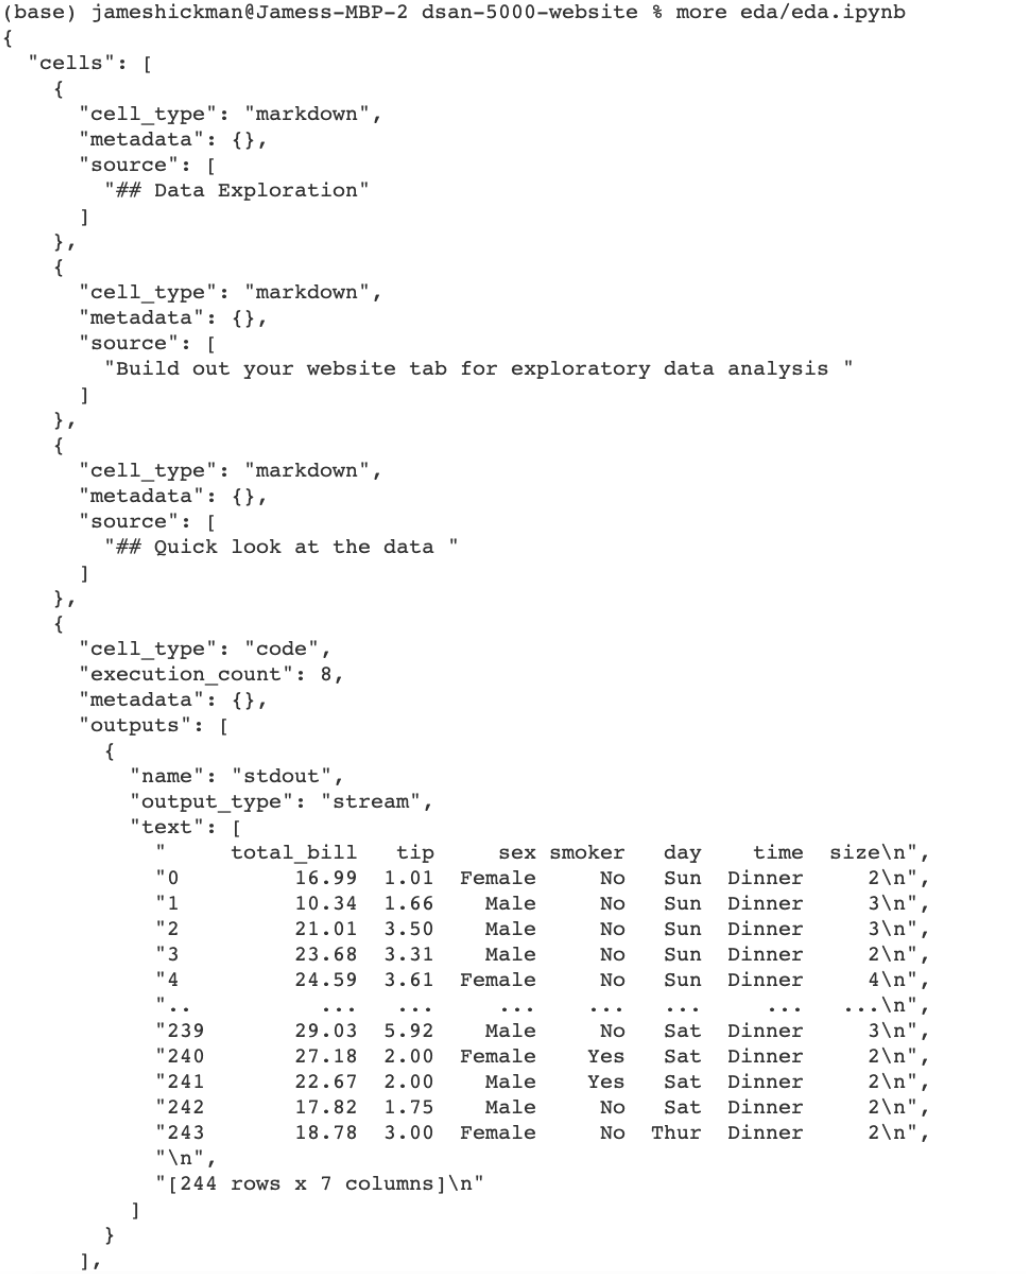
Aside: .ipynb are JSON files
- An
.ipynbfile is simply aJSONfile with a specialized structural format - You can see this by running
more eda/eda.ipynbfrom the command line - Which will output the following;
Debugging
Comments on debugging code-2
Remember, effective debugging is often a combination of systematic analysis, creativity, and persistence. Different situations may require different approaches, so adapt these best practices based on your specific context.
- Check Inputs and Outputs:
- Verify input data and parameters for correctness.
- Monitor output values and results to spot discrepancies.
- Use Debugging Tools:
- Utilize integrated development environment (IDE) tools like breakpoints, watches, and variable inspection.
- Use debugging libraries or third-party tools for more advanced debugging.
- Print and Log:
- Insert print statements or log messages at critical points to trace code execution and variable values.
- Search for Documentation:
- Consult official documentation, forums, and resources related to the programming language, libraries, or frameworks you’re using.
- Avoid Hasty Changes:
- Make deliberate changes while debugging, and test each change to understand its impact.
- Divide and Conquer:
- Split the code into smaller parts and test them individually to identify the problematic section.
- Read Error Messages:
- Carefully read error messages and stack traces to understand where the issue originates.
Comments on debugging code-1
Remember, effective debugging is often a combination of systematic analysis, creativity, and persistence. Different situations may require different approaches, so adapt these best practices based on your specific context.