Interactivity fundamentals: HTML, CSS, and JavaScript

Interactivity fundamentals

Download the example files

Why interactivity?

Static communication

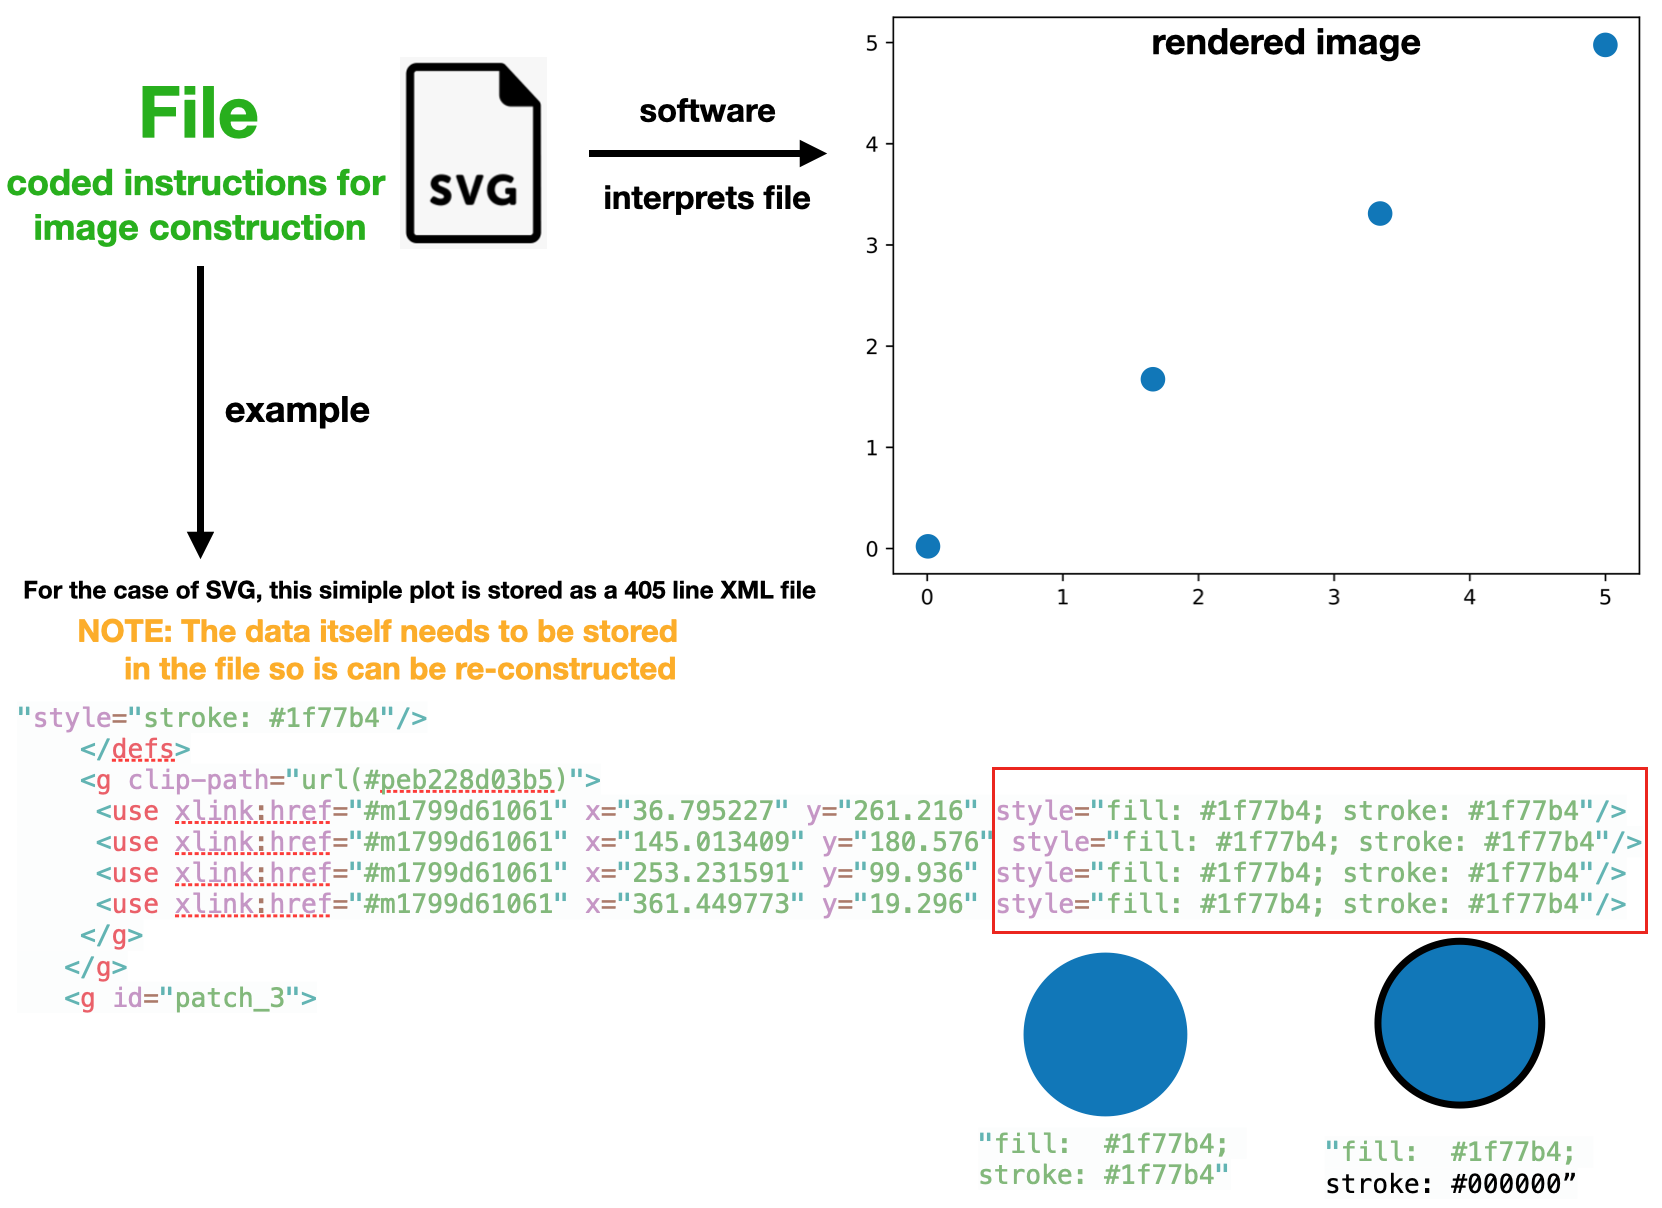
  • A static graphic shows a fixed view of the data.
  • Excellent when the message is known in advance.
  • The reader sees what the author chose to display.
Interactive communication

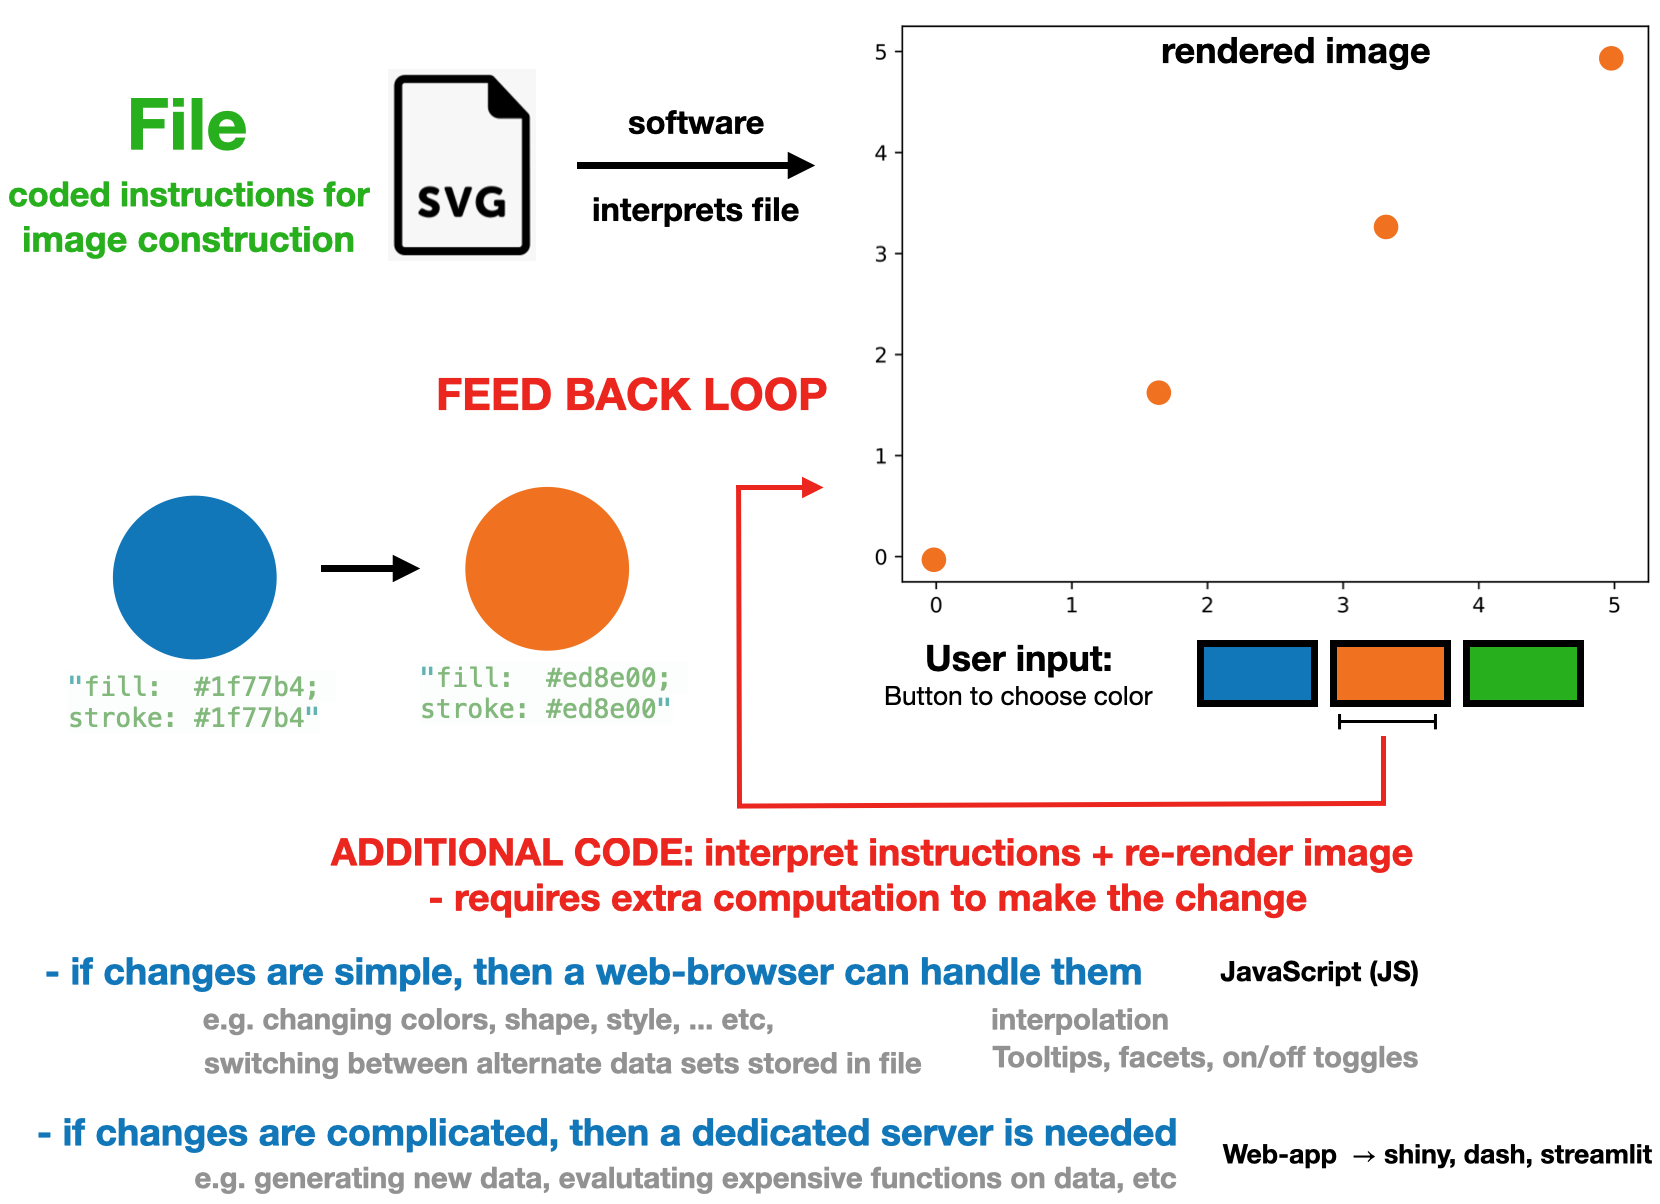
  • Users can explore: hover, filter, zoom, select, or animate.
  • One graphic can reveal multiple views of a complex dataset.
  • Interaction becomes another visual encoding.
The web stack: three jobs

HTML = structure

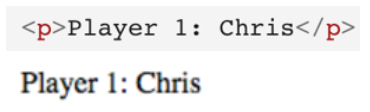
Defines the content: headings, text, buttons, images, and containers.
CSS = appearance

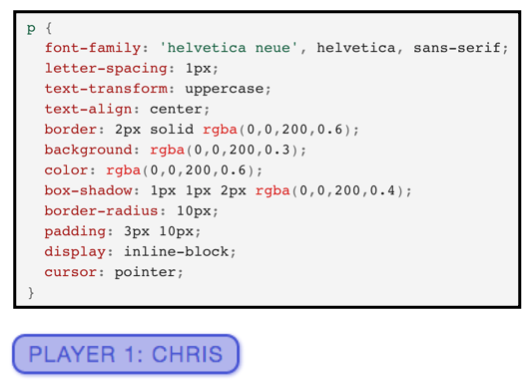
Controls presentation: color, typography, spacing, and layout.
JavaScript = behavior

Responds to events and changes the page programmatically.
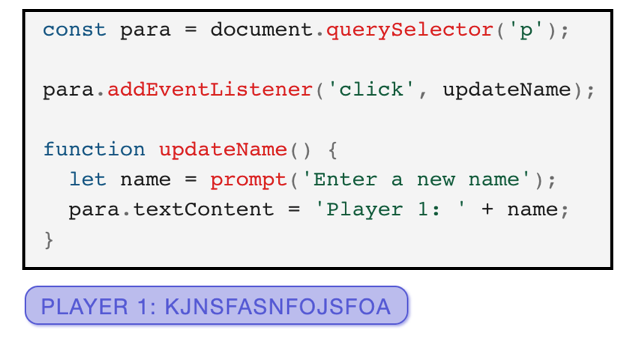
For interactive visualization: HTML provides a place for the chart, CSS styles it, and JavaScript creates and updates it.

What happens in the browser?
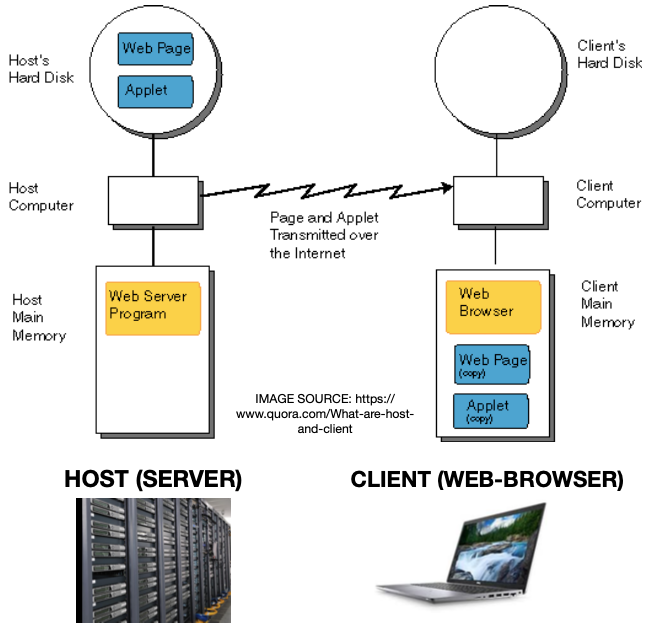
  1. The browser requests HTML, CSS, JavaScript, data, and other assets.
  2. It turns the HTML into a structured representation of the page.
  3. CSS determines how that structure looks.
  4. JavaScript can react to user actions and modify the page while it is open.

Key idea: interactive charts are small programs running in or alongside a webpage.

HTML, CSS, and the DOM

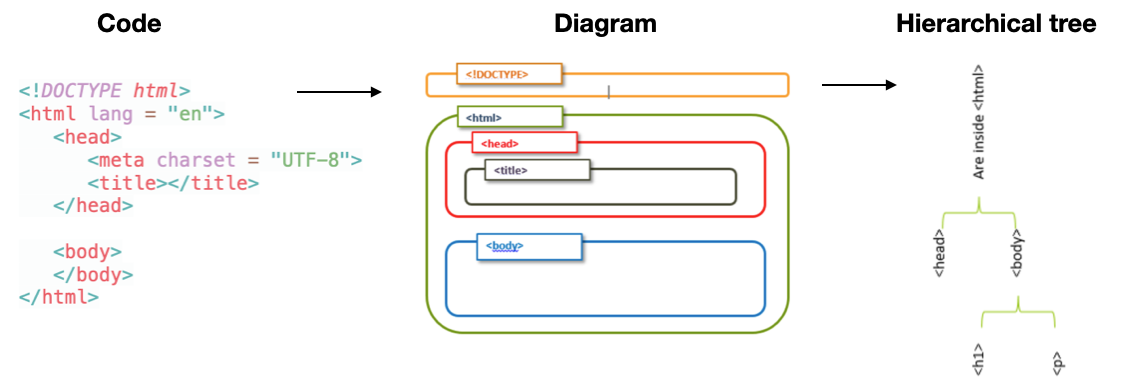
HTML: a hierarchy of elements

<body>
  <h2>Sales dashboard</h2>
  <p id="status">Choose a region.</p>
  <div id="chart"></div>
</body>
  • HTML is built from elements such as headings, paragraphs, buttons, and <div> containers.
  • Elements can have attributes such as id and class.
  • Elements are nested, so the page naturally forms a tree.
CSS: style without changing structure

#chart {
  width: 700px;
  height: 420px;
}

.highlight {
  color: steelblue;
  font-weight: bold;
}
  • CSS uses selectors to target HTML elements.
  • It separates content from presentation.
  • Visualization libraries often generate HTML/SVG for us; CSS can still control the surrounding layout and styling.

You do not need to become a web developer: recognize the roles of HTML and CSS so generated interactive graphics are less mysterious.

The DOM: the bridge to interactivity

The Document Object Model (DOM) is the browser’s object representation of the HTML page.
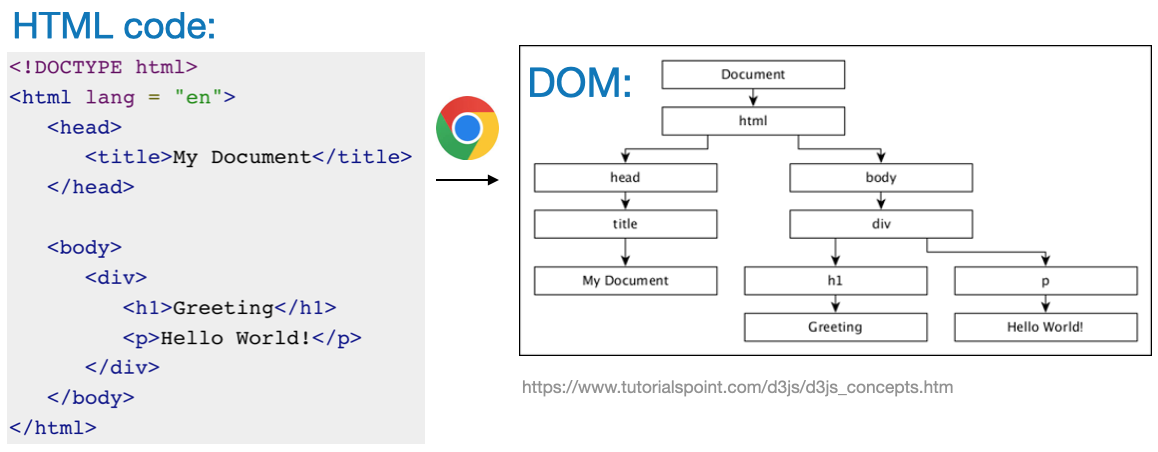
JavaScript can use the DOM to:

  • find an element,
  • read or change its content,
  • add or remove elements,
  • respond to events such as clicks or input changes.

Mental model: HTML creates the tree; JavaScript can edit the tree.

SVG: graphics are also elements

  • SVG (Scalable Vector Graphics) represents shapes such as circles, lines, rectangles, and text as markup.
  • Because SVG elements live in the DOM, JavaScript can change their position, size, color, or visibility.
  • This is one reason browser-based visualization can be highly interactive.
<svg width="220" height="100">
  <circle cx="60" cy="50" r="30" fill="steelblue"></circle>
  <rect x="120" y="25" width="70" height="50" fill="orange"></rect>
</svg>
JavaScript: just enough for visualization

What JavaScript contributes

JavaScript is the programming language that makes browser content dynamic.

For data visualization, it commonly handles:

  • loading or transforming data,
  • responding to clicks, selections, sliders, or hover events,
  • changing HTML/SVG elements,
  • calling libraries such as Plotly.js or D3.

You mainly need to recognize familiar programming ideas: variables, arrays/objects, functions, loops, and function calls.

A tiny raw JavaScript example

<p id="message">Waiting...</p>
<button onclick="updateMessage()">Click me</button>

<script>
function updateMessage() {
  const element = document.getElementById("message");
  element.textContent = "The page changed without reloading.";
}
</script>

What happened?

  1. The button fires a click event.
  2. JavaScript finds an HTML element by its id.
  3. JavaScript changes that element in the DOM.

This same pattern powers filters, tooltips, linked charts, and dashboards.

Example: a small numerical-integration app

The raw JavaScript can also perform computation based on user input.

function f(x) { return 3*x*x + 4*x; }

function integrate(A, B, N) {
  const dx = (B - A) / N;
  let sum = 0;

  for (let i = 0; i < N; i++) {
    const x = A + (i + 0.5) * dx;   // midpoint
    sum += f(x) * dx;
  }
  return sum;
}

const estimate = integrate(0, 2, 100);
document.getElementById("output").textContent = estimate;

Takeaway: browser JavaScript can combine inputs + computation + DOM updates into an interactive app.

The complete example is included in HTML-JS-D3-examples.zip (INTEGRATE.html).

Visualization libraries

Why use a library?

You could manually create and update every SVG element—but visualization libraries package common patterns for us.

High-level libraries

Examples: Plotly.js, Vega-Lite

  • concise chart specifications
  • built-in hover, zoom, legends, selections
  • fast path to useful interactive graphics

Lower-level libraries

Example: D3.js

  • direct control over data-driven DOM/SVG transformations
  • extremely flexible
  • more code and a steeper learning curve

Choose the highest-level tool that gives you the control you need.

Plotly.js: interactive charts with little code

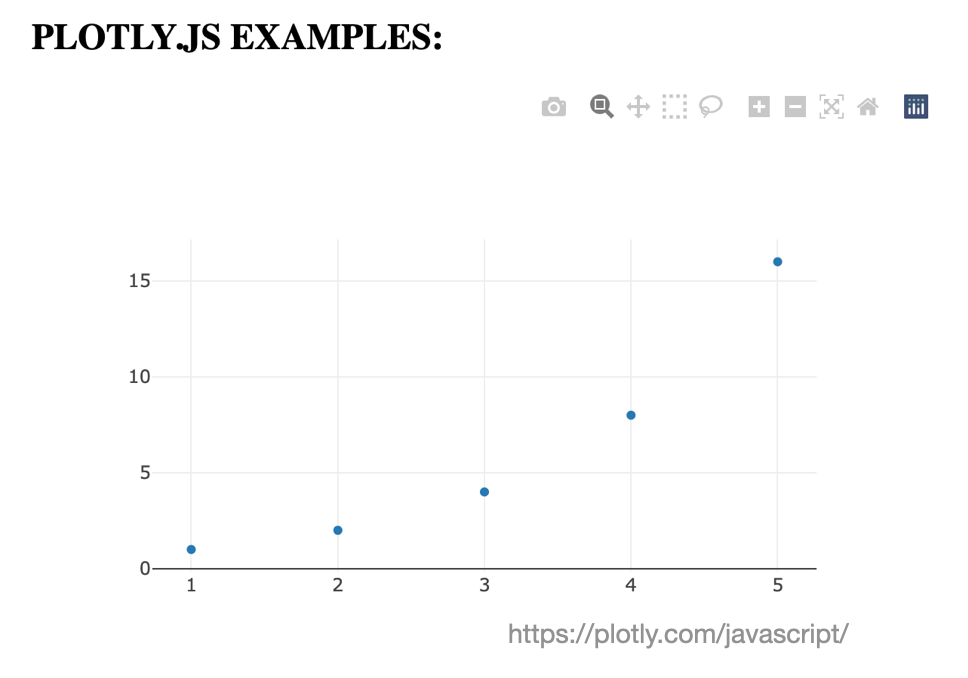
Plotly.js is a browser-based graphing library that provides many chart types and common interactions out of the box.

<div id="myPlot"></div>
<script src="https://cdn.plot.ly/plotly-2.35.2.min.js"></script>

<script>
const data = [{
  x: [1, 2, 3, 4, 5],
  y: [1, 2, 4, 8, 16],
  mode: "lines+markers",
  type: "scatter"
}];

Plotly.newPlot("myPlot", data);
</script>
What Plotly.js is doing for us

The code has the same basic ingredients we just learned:

  1. HTML supplies <div id="myPlot"> — a container for the chart.
  2. JavaScript stores the data and calls Plotly.newPlot(...).
  3. Plotly.js creates the necessary graphical elements and interaction logic.
  4. The browser renders the result and handles user events.

This is the motivation for learning the web stack: you can use high-level libraries without treating them as a black box.

D3.js: data-driven control of the DOM

D3 = Data-Driven Documents

  • D3 binds data to DOM elements and helps create or update HTML/SVG from that data.
  • It provides lower-level building blocks for custom interactive visualizations.
  • Many higher-level visualization tools build on similar web concepts.
d3.select("#chart")
  .append("circle")
  .attr("cx", 60)
  .attr("cy", 60)
  .attr("r", 30)
  .style("fill", "steelblue");

For this course, the important point is the model, not memorizing the D3 API.

Common forms of interaction

  • Hover: reveal details on demand
  • Filter / select: focus on a subset
  • Pan / zoom: navigate dense or spatial data
  • Linked views: a selection in one chart updates another
  • Animation / transitions: show change or guide attention

Interactivity is most useful when it helps the viewer answer a question that would be difficult with one fixed view.

Big picture

DATA
  ↓
JavaScript / visualization library
  ↓
HTML + SVG elements in the DOM
  ↓
CSS + browser rendering
  ↓
INTERACTIVE GRAPHIC
  ↕
user events: hover • click • filter • zoom

Remember the roles:

  • HTML → structure
  • CSS → appearance
  • JavaScript → behavior
  • Plotly.js / D3 / other libraries → reusable visualization machinery

You do not need to build everything from scratch—you need enough of the foundation to understand and customize the tools you use.

Optional resources / demo

Explore the included examples

Download the example files

Useful files to inspect after class: - INTEGRATE.html — raw JavaScript + user input + computation - JS-Plotting/ — JavaScript plotting examples - EX-D3/ — progressively more detailed D3/SVG examples - html-cheatsheet.zip — HTML reference material

These are optional extensions, not material you need to memorize for the introductory lecture.