import numpy  as np
import pandas as pd
import time

import matplotlib.pyplot as plt

from  scipy.io.wavfile import write
from  scipy.io.wavfile import read
from  scipy.fft        import fft,fftfreq,ifft
from  scipy.signal     import correlate

import vlc
# python -m pip install python-vlc
# download: https://www.videolan.org/vlc/download-macosx.htmlSound data demonstration
Python
Import
Parameters
#INPUT PARAM
R=44100     #44.1kHz=standard sampling rate for audio
# R=R/10
Utility functions
#FUNCTION TO BUILD MESH BASED ON FREQUENCIES
def construct_mesh(F):
    global T,t,dt
    num_cycle=int(2.*F)
    T = num_cycle/F #total length of sound in seconds
    t = np.linspace(0,T,int(R*T))
    t = t[0:-1]
    dt= t[1]-t[0];      #TIMESTEP (seconds)

#-------------------
#VISUALIZE WAVEFORM
#------------------
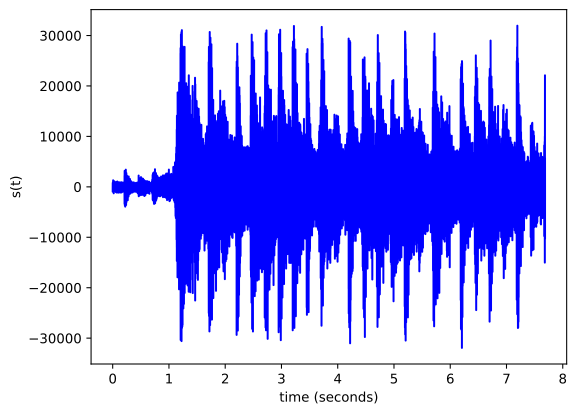
def visualize_wave(T=-1):
    #SHOW INITIAL PART OF WAVEFORM
    ax = plt.subplot()
    ax.plot(t[0:int(T)], s[0:int(T)], 'b-')

    #AXIS LABELS
    ax.set_xlabel('time (seconds)')
    ax.set_ylabel('s(t)')
    plt.show()

def play_waveform(sf=1):
    # NORMALIZE (PREVENT SPEAKER DAMAGE)
    sn=sf*s/max(s)

    #SAVE TO MP3 THEN PLAY
    write('output.mp3', R, sn)
    p = vlc.MediaPlayer("output.mp3")
    p.play(); time.sleep(T);
    p.stop()
Sounds data example:
Music-1
in_put = read("jamming-1.wav")

# #DEFINE ARRAYS
R=in_put[0]     #SAMPLE RATE
s=in_put[1]     #ARRAY
s=s-np.mean(s)
T=len(s)/R
t=np.linspace(0,T,int(R*T)); print(t.shape,s.shape)
dt= t[1]-t[0];      #TIMESTEP (seconds)
visualize_wave(T=R)
visualize_wave(T=-1)
play_waveform(sf=1)
(368896,) (368896,)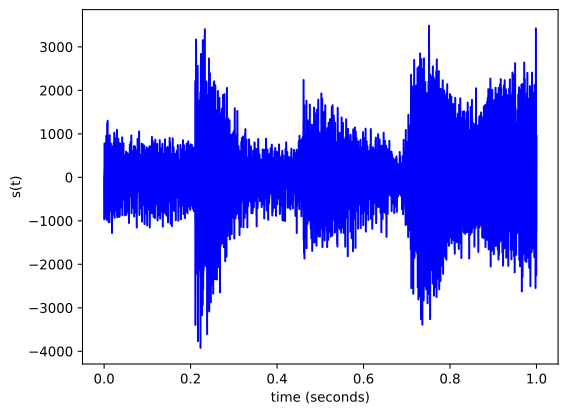
[00007fc46962e330] auhal audio output error: AudioObjectAddPropertyListener failed, device id 198, prop: [atfp], OSStatus: 1852797029
[00007fc46962e330] auhal audio output error: AudioObjectAddPropertyListener failed, device id 43, prop: [atfp], OSStatus: 1852797029
[00007fc46962e330] auhal audio output error: AudioObjectAddPropertyListener failed, device id 55, prop: [atfp], OSStatus: 1852797029
[00007fc46962e330] auhal audio output error: AudioObjectAddPropertyListener failed, device id 198, prop: [atfp], OSStatus: 1852797029
[00007fc46962e330] auhal audio output error: AudioObjectAddPropertyListener failed, device id 43, prop: [atfp], OSStatus: 1852797029
[00007fc46962e330] auhal audio output error: AudioObjectAddPropertyListener failed, device id 55, prop: [atfp], OSStatus: 1852797029
[00007fc46962e330] auhal audio output error: AudioObjectAddPropertyListener failed, device id 198, prop: [atfp], OSStatus: 1852797029
[00007fc46962e330] auhal audio output error: AudioObjectAddPropertyListener failed, device id 235, prop: [atfp], OSStatus: 1852797029
[00007fc46962e330] auhal audio output error: AudioObjectAddPropertyListener failed, device id 43, prop: [atfp], OSStatus: 1852797029
[00007fc46962e330] auhal audio output error: AudioObjectAddPropertyListener failed, device id 55, prop: [atfp], OSStatus: 1852797029
[00007fc46962e330] auhal audio output error: AudioObjectAddPropertyListener failed, device id 198, prop: [atfp], OSStatus: 1852797029
[00007fc46962e330] auhal audio output error: AudioObjectAddPropertyListener failed, device id 43, prop: [atfp], OSStatus: 1852797029
[00007fc46962e330] auhal audio output error: AudioObjectAddPropertyListener failed, device id 55, prop: [atfp], OSStatus: 1852797029
[00007fc46962e330] auhal audio output error: AudioObjectAddPropertyListener failed, device id 198, prop: [atfp], OSStatus: 1852797029
[00007fc46962e330] auhal audio output error: AudioObjectAddPropertyListener failed, device id 43, prop: [atfp], OSStatus: 1852797029
[00007fc46962e330] auhal audio output error: AudioObjectAddPropertyListener failed, device id 55, prop: [atfp], OSStatus: 1852797029
[00007fc46962e330] auhal audio output error: AudioObjectAddPropertyListener failed, device id 198, prop: [atfp], OSStatus: 1852797029
[00007fc46962e330] auhal audio output error: AudioObjectAddPropertyListener failed, device id 241, prop: [atfp], OSStatus: 1852797029
[00007fc46962e330] auhal audio output error: AudioObjectAddPropertyListener failed, device id 43, prop: [atfp], OSStatus: 1852797029
[00007fc46962e330] auhal audio output error: AudioObjectAddPropertyListener failed, device id 55, prop: [atfp], OSStatus: 1852797029
[00007fc46962e330] auhal audio output error: AudioObjectAddPropertyListener failed, device id 198, prop: [atfp], OSStatus: 1852797029
[00007fc46962e330] auhal audio output error: AudioObjectAddPropertyListener failed, device id 43, prop: [atfp], OSStatus: 1852797029
[00007fc46962e330] auhal audio output error: AudioObjectAddPropertyListener failed, device id 55, prop: [atfp], OSStatus: 1852797029
Lag plots
show_lag_plot=False
NMAX=100
if show_lag_plot:

    #METHOD-1: PANDAS

    # #DOUBLE CHECK WITH PANDAS
    sp = pd.Series(s)

    #SHIFT SIGNAL BY 25% OF PERIOD
    lag=int(0.25*len(s))   #tag in terms of number of data point to shift
    tau=dt*lag      #lag in time units
    pd.plotting.lag_plot(sp, lag=lag)
    plt.show()


    #METHOD-2: MANUALLY

    #LOOP OVER SEVERAL LAGS
    NLAG=2  #NUMBER OF LAG PLOTS
    for i in range(0,NLAG+1):

        #LAG
        # lag=int((i/NLAG)*len(t))      #tag in terms of number of data point to shift
        lag=50*i                    #tag in terms of number of data point to shift
        tau=dt*lag                  #lag in time units

        y1=s
        y2=np.roll(s,lag)

        #COMPUTE CROSS CORRELATION
        print("------------------")
        print("TAU: ", tau)
        print("COVARIANCE(y1,y2): ", np.mean((y1-np.mean(y1))*(y2-np.mean(y2))))
        print("PEARSON CORRELATION(y1,y2): ", np.mean((y1-np.mean(y1))*(y2-np.mean(y2)))/np.std(y1)/np.std(y2))
        # print("STD-1, STD-2:", np.std(y1),np.std(y2))

        #COMPARE WAVE FORMS
        plt.ylabel("f(t) (red)          f(t-tau) (blue)")
        plt.xlabel('t')
        plt.plot(t[0:NMAX],y1[0:NMAX], 'r-o')
        plt.plot(t[0:NMAX],y2[0:NMAX], 'b-')
        plt.show()

        #PARITY PLOT
        plt.xlabel('PARITY PLOT')
        plt.xlabel('f(t)')
        plt.ylabel("f(t-tau)")
        plt.plot(y1,y2, 'b-o')
        plt.show()
Spectral analysis
N=len(s);           #NUMBER OF POINTS
fn=fftfreq(N)/(dt)  #SET OF FREQ FOR PLOTTING (Hz)
# FOURIER TRANSFORM
FT=fft(s)
# EXTRACT SIN AND COS AMPLITUDES
# (FACTOR OF 2 IS FOR CONVERSION FROM REAL TO COMPLEX)
# sum(an*cos(wt)+bn*sin(wt))
an=2*np.real(FT)/N
bn=-2*np.imag(FT)/N
SPD=np.absolute(FT)**2.0
# PLOT SIN/COS AMPLITUDES
plt.plot(fn,an, '-o'); plt.show()
plt.plot(fn,bn, '-o'); plt.show()

#SPECTRAL POWER DENSITY
#(FACTOR OF 4 IS FOR CONVERSION FROM REAL TO COMPLEX)
#N SQUARE IS FOR SCIPY NORMALIZATION CONVENTION
plt.plot(fn,4*SPD/N/N,'-o'); plt.show()
#INVERSE TRANSFORM (CONVERT BACK TO ORIGINAL SIGNAL)
s2=ifft(FT)
plt.plot(t, s2, 'ro')
plt.plot(t, s, 'b-')
plt.show()
/Users/jameshickman/miniconda3/envs/anly503/lib/python3.10/site-packages/matplotlib/cbook/__init__.py:1369: ComplexWarning: Casting complex values to real discards the imaginary part
return np.asarray(x, float)
#-------------------
#AUTO-CORRELATION FUNCTION:
#-------------------

#ACF BY WK THEOREM (1/N is )
#1/N is to compute the average ifft(SPD) returns ACF sum not the average
plt.plot(t,np.real(ifft(np.absolute(fft(s))**2.0))/N, 'o');

#DIRECT COMPUTE WITH NUMPY

# np.correlate example
    # INDICES FOR LEN=4 --> 0 1 2 3
    # tau -3        -2       -1       0        1        2         3
    #      0 1 2 3  0 1 2 3  0 1 2 3  0 1 2 3  0 1 2 3  0 1 2 3   0 1 2 3
    # X    0        0 1      0 1 2    0 1 2 3    1 2 3      2 3         3
    # Y    3        2 3      1 2 3    0 1 2 3    0 1 2      0 1         0

tau=range(-N+1,N)*dt;  tau=tau[N:]
acf_direct=np.correlate(s, s, mode='full')
acf_direct=acf_direct[N:]
plt.plot(tau,acf_direct/N, '-');        #expected solution

plt.show()
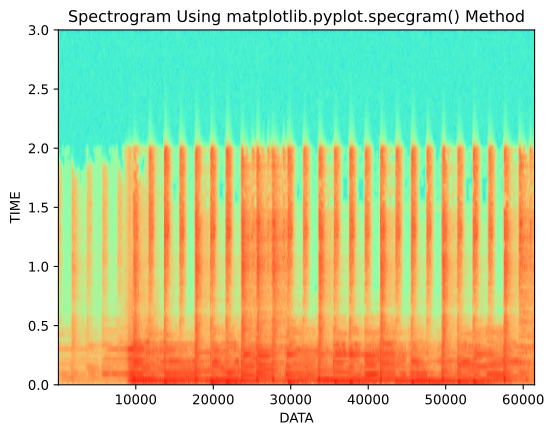
Spectrogram
import math
import numpy as np
import matplotlib.pyplot as plt

print(s.shape)
# Matplotlib.pyplot.specgram() function to
# generate spectrogram
plt.specgram(s, Fs=6, cmap="rainbow")

# Set the title of the plot, xlabel and ylabel
# and display using show() function
plt.title('Spectrogram Using matplotlib.pyplot.specgram() Method')
plt.xlabel("DATA")
plt.ylabel("TIME")
plt.show()
(368896,)