import numpy  as np
import pandas as pd
import time

import matplotlib.pyplot as plt

from  scipy.io.wavfile import write
from  scipy.io.wavfile import read
from  scipy.fft        import fft,fftfreq,ifft
from  scipy.signal     import correlate

import vlc
# python -m pip install python-vlcHow does it work?
Let’s take a closer look at the questions from our discussion!
Note: We do some code examples in this section, if you would like to download the notebook and try it for yourself. To download the code and files, click the following link!
Click here to download the notebook which generated this demonstration!
Aside: This website was created with a software tool called Quarto. It is popular for publishing technical content and used heavily in our program. Quarto software provides a platform for collaborative document creation and publishing. Users can write, design, and share documents seamlessly, incorporating various media formats and interactive elements. Quarto simplifies content creation and distribution across diverse digital platforms. For more, consider visiting their website https://quarto.org/.
What does the raw input data look like?
Sound consists of mechanical oscillations (vibrations of air molecules) called longitudinal waves. Vibrations create regions of compression and rarefaction in a medium.
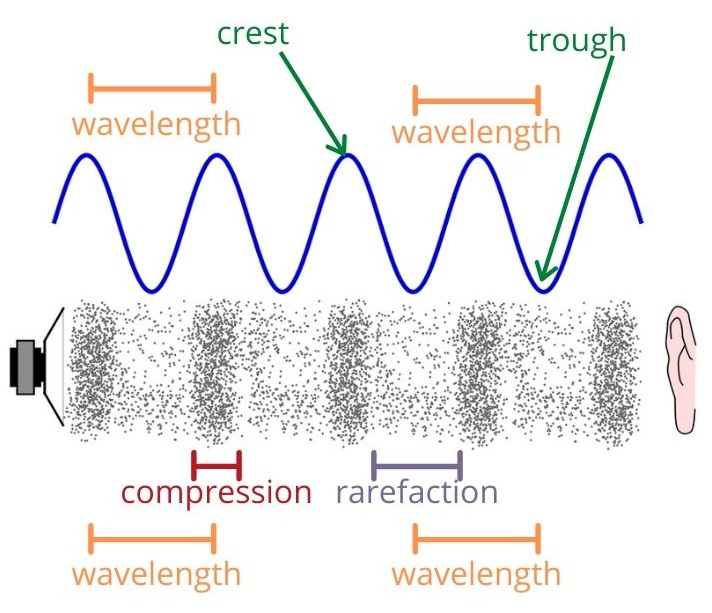
A microphone captures sound by converting acoustic energy (sound waves) into electrical signals. It uses a diaphragm to detect vibrations, which are then converted into electrical signals through a transducer, resulting in a wave form, whose amplitude quantifies the size of the acoustic perturbation.
Example
Lets capture a recording of the crow sound
Lets save this to a sound file crow.mp4
Loading the data
Lets load this file into python and explore it a bit!
First we need to import some useful packages
Now let’s create some ultility functions to help process and visualize the data.
Don’t worry if these look a bit confusing, they are just do some basic plotting.
#VISUALIZE WAVEFORM
def visualize_wave(T=-1):
    #SHOW INITIAL PART OF WAVEFORM
    ax = plt.subplot()
    ax.plot(t[0:int(T)], s[0:int(T)], 'b-')

    #AXIS LABELS
    ax.set_xlabel('time (seconds)')
    ax.set_ylabel('s(t)')
    plt.show()

# LIST TO WAVEFORM
def play_waveform(sf=1):
    # NORMALIZE (PREVENT SPEAKER DAMAGE)
    sn=sf*s/np.max(s)

    # #SAVE TO MP3 THEN PLAY
    write('output.mp3', R, sn)
    p = vlc.MediaPlayer("output.mp3")
    p.play(); time.sleep(T);
    p.stop()
# Load data
in_put = read("crow.wav")
# DEFINE ARRAYS
R=in_put[0] #SAMPLE RATE
s=in_put[1] #ARRAY
s=s[:,0]
s=s-np.mean(s)
T=len(s)/R
t=np.linspace(0,T,int(R*T)); print(t.shape,s.shape)
dt= t[1]-t[0]; #TIMESTEP (seconds)
print(t.shape,s.shape)(534781,) (534781,)
(534781,) (534781,)# run our utility function
visualize_wave(T=R)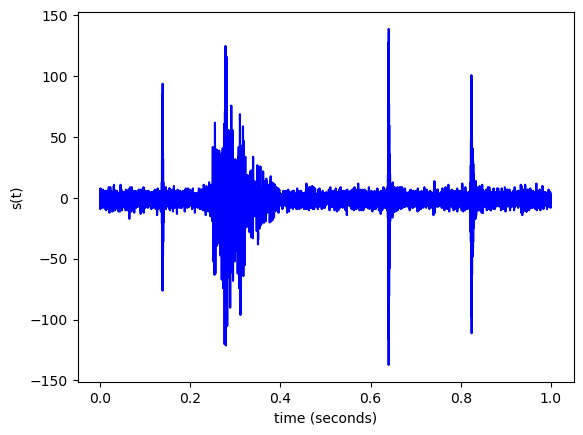
# listen to the wave
# play_waveform(sf=1)
Our ultimate goal is to get the audio signal ready for processing, to do this, we need to produce the spectrogram
# Matplotlib.pyplot.specgram() function to
# generate spectrogram
print(s.shape)
plt.specgram(s, Fs=6, cmap="rainbow")

# Set the title of the plot, xlabel and ylabel
# and display using show() function
plt.title('Spectrogram Using matplotlib.pyplot.specgram() Method')
plt.xlabel("Time-step")
plt.ylabel("Frequency")
plt.show()
(534781,)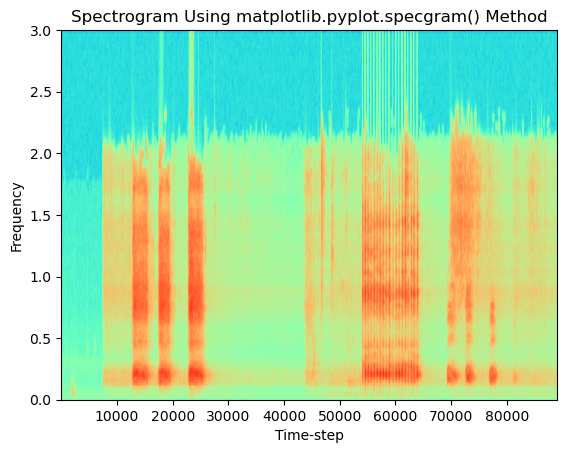
As a sanity check, lets compare this with what we saw on the app.
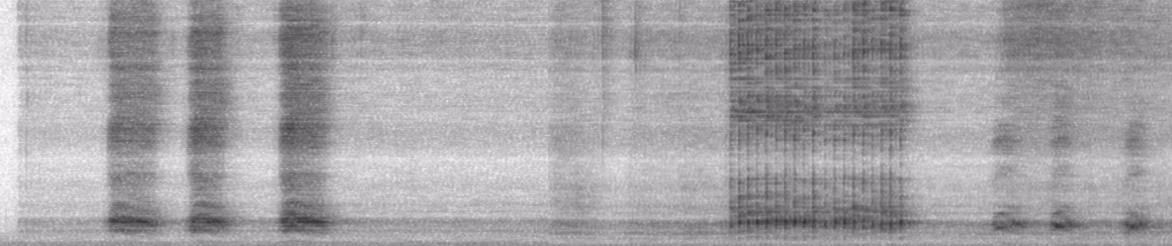
Look pretty good! I think we are on the right track.
Lets take a minute ot think about what this spectrogram is.
Understanding the data: The Structure of sound
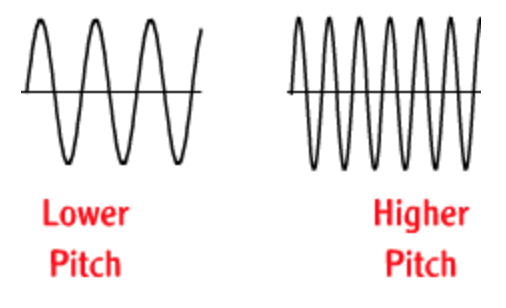
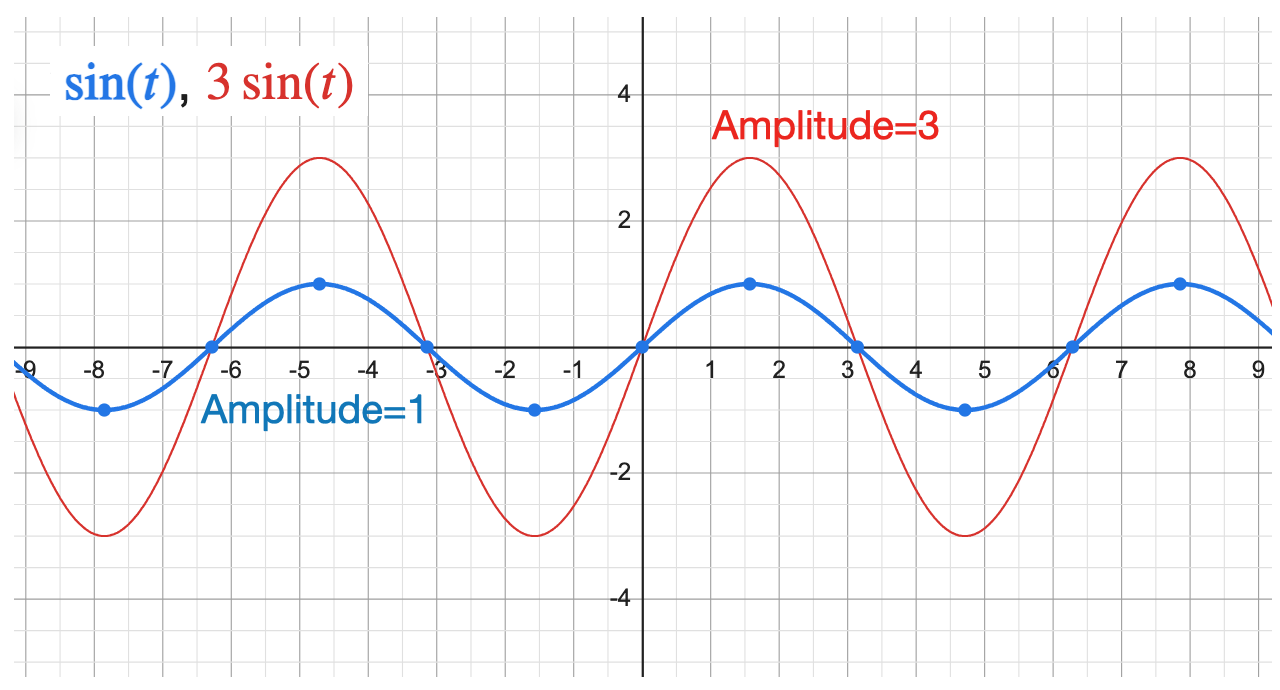
Sounds is made up of many waves with different pitch (frequency) and volumes (amplitude)
Pitch (frequency)
Amplitude (volume)
Sound wave
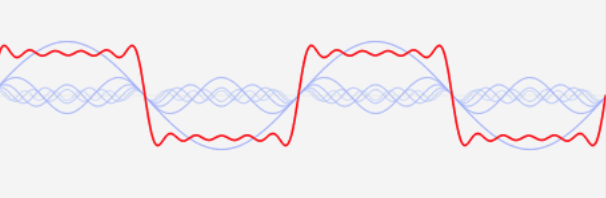
Generally, sound waves are composed of thousands of individual sine and cosine waves, each with a different frequency and amplitude.
For example:
Or in the case of our crow sound example
visualize_wave(T=R)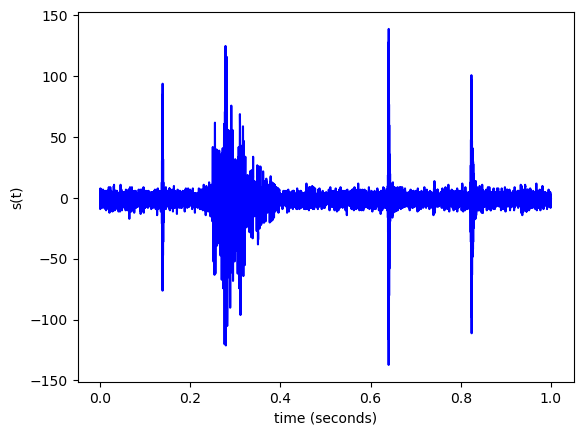
How is the data transformed for processing?
Raw waveforms \(t,s(t)\), representing sound, lack the structured information that machine learning (ML) algorithms require.
Decomposing a sound wave
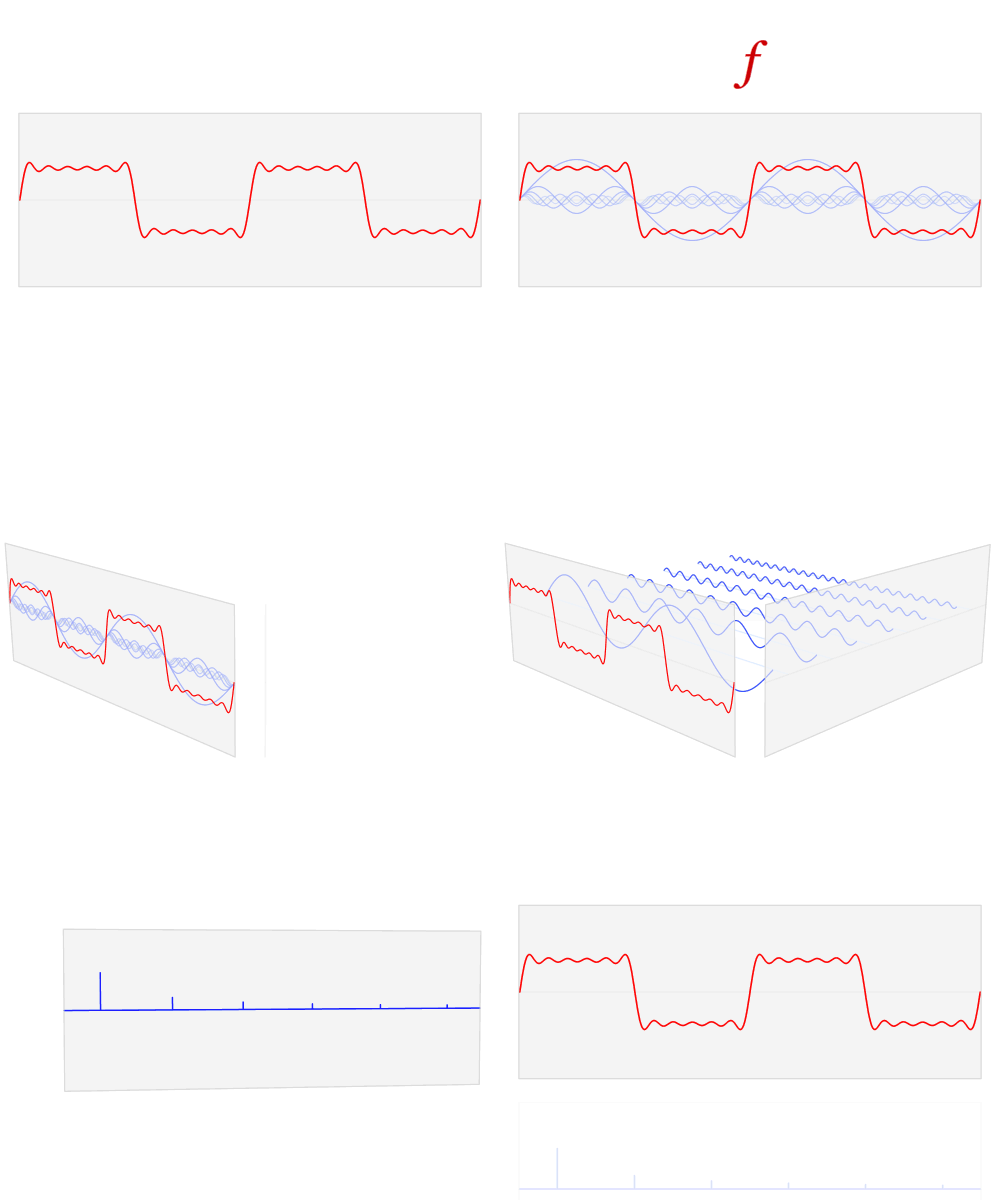
Fortunately, there are mathematical tricks to decompose a sound wave into its fundamental parts. By breaking it up and analyzing its frequency components using techniques like the Fourier transform, we can reveal its spectral content and underlying harmonics.
To extract frequency content, we have two options Fourier transforms and spectrogram
Fourier transformsanalyze signals, decomposing them into constituent frequencies. They’re vital in signal processing, helping understand complex data by revealing underlying frequency components through mathematical transformation.
- A
spectrogramvisually represents thefrequencies present in a signal over time. It displays how the intensity of different frequencies changes, offering insights into sound characteristics and patterns.
For ML, we typically go with the spectrogram, since it gives us a more granular, time dependent representation.
Why did we do this? Image data is easier to work with than audio data!
Computer vision is very well studied in the field of deep learning (machine learning with neural networks), once the audio data is in the visual representation, i.e. spectrogram, we can apply all an array of powerful Computer vision tools .
This provides an alternative mathematical representation, transforming data into various mathematical representations is a fundamental concept to machine learning.
Once the audio signal is converted to a spectrogram, it is essentially now a form of image data. Which remaps the audio learning problem onto a computer vision problem!
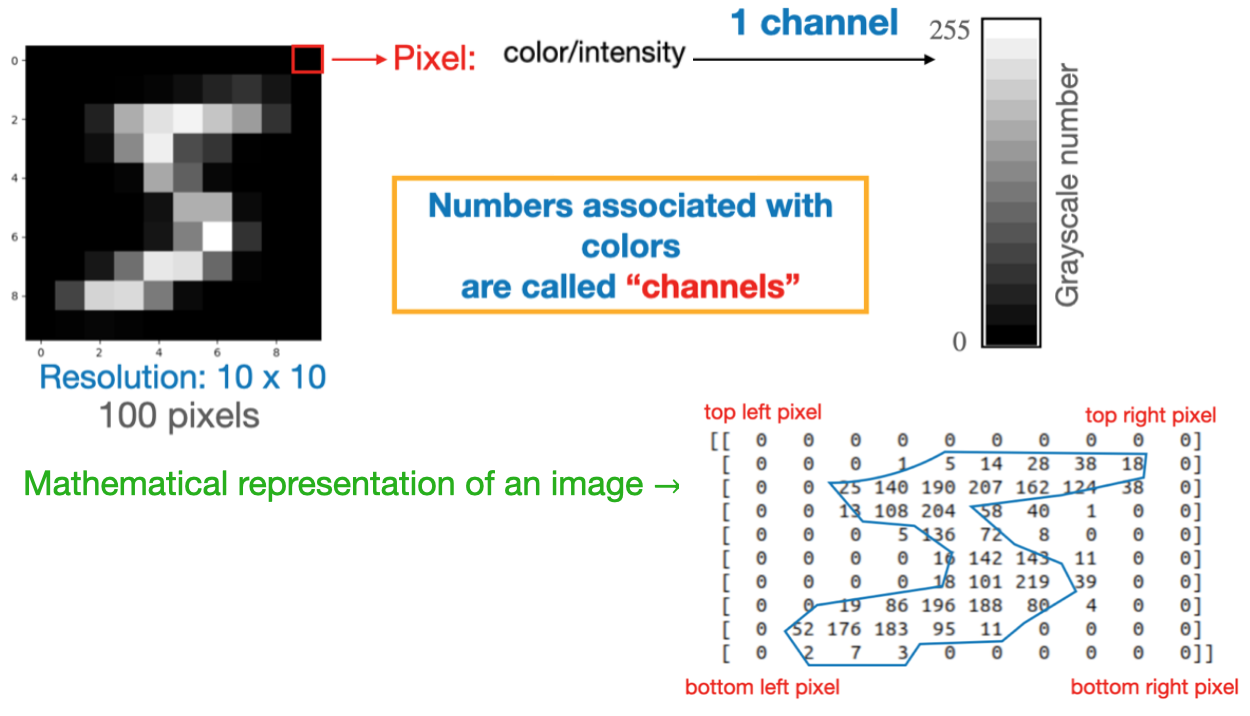
Aside: Image data
Images are data! They’re represented as arrays (matrices) of pixel values, where each pixel’s intensity or color is encoded numerically. These arrays serve as input data for image processing and analysis algorithms.
Here, we show perhaps the simplest possible example of image data: a low-resolution, black & white (Grayscale), handwritten numerical digit five:
What type of machine learning is it doing?
Broadly speaking, machine learning falls into three categories.
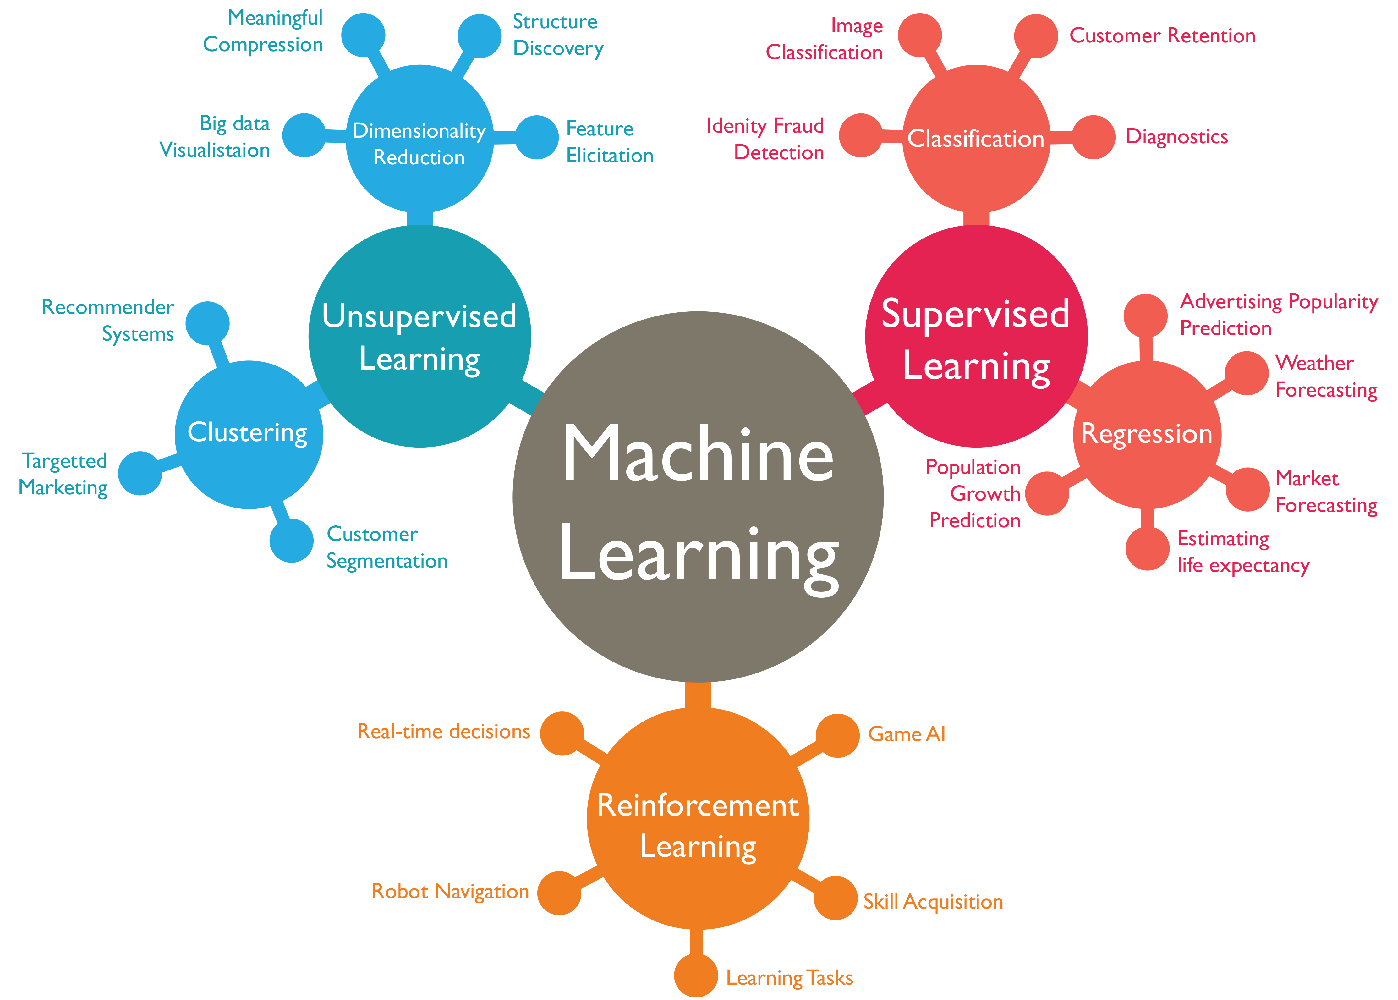
- Supervised Learning:
- Trained on labeled data.
- Learns patterns to make predictions or decisions.
- Examples include classification and regression tasks.
- Unsupervised Learning:
- Trained on unlabeled data.
- Discovers patterns and structures in data.
- Examples include clustering and dimensionality reduction.
- Reinforcement Learning:
- Learns through interaction with an environment.
- Aims to maximize rewards over time by taking actions.
- Examples include game playing and robotic control.
The Sound-ID in the Merlin app is a textbook example of supervised machine learning. Specifically a very common learning task known as multi-class classification.
Types of classification learning
The two most common types of classification learning in machine learning are
- Binary classification: Binary classification involves categorizing data into one of two classes or categories, typically represented as “positive” and “negative,” based on input features and a defined decision boundary.
Example: Classifying whether an image contains acator adog
- Multi-class classification: Multi-class classification involves categorizing data into one of multiple classes or categories, where each instance belongs to only one class, based on input features and defined decision boundaries.
Example: Classifying whether an image contains acat, adog, atree, or ahouseExample: Classifying whether a spectrogram contains acrow, arobin, aswallow, or apigeon
Supervision of the Merlin App
Supervision in machine learning refers to providing labeled data to train a model, enabling it to learn associations between input features and output labels, facilitating accurate classification predictions.
For the Merlin app, the Sound-ID model underwent training to recognize birds, using 140 hours of bird sound recordings and 126 hours of non-bird background sounds such as whistling and car noises. Expert sound ID teams from the Macaulay Library and the eBird community meticulously identified bird sounds within each clip and assigned them to the appropriate species. This detailed supervision from experts allowed the model to effectively learn and predict the species present in annotated audio clips.
What is the goal of supervised machine learning? … to make predictions on unseen data!
What type of model is it using?
Deep neural networks are particularly good at multi-class classification learning.
As your phone records sound, Merlin converts the audio into an image called a spectrogram. The spectrogram plots sound frequencies that appear in the recording, as a function of time. This spectrogram image is then fed into a modern computer vision model called a deep convolutional neural network.
Training vs Prediction
Once the model is trained, now it is time to “set it free”, and share it with the world so that anyone can make predictions of what type of birds they are hearing. The training phase in machine learning involves teaching a model using labeled data to learn patterns, while inference applies the learned patterns to new, unlabeled data for prediction or classification.
Model type
A deep convolutional neural network (CNN) is a complex artificial neural network designed for image processing tasks. It consists of multiple layers with convolutional filters, enabling it to automatically learn hierarchical features from input images, leading to effective pattern recognition and classification.
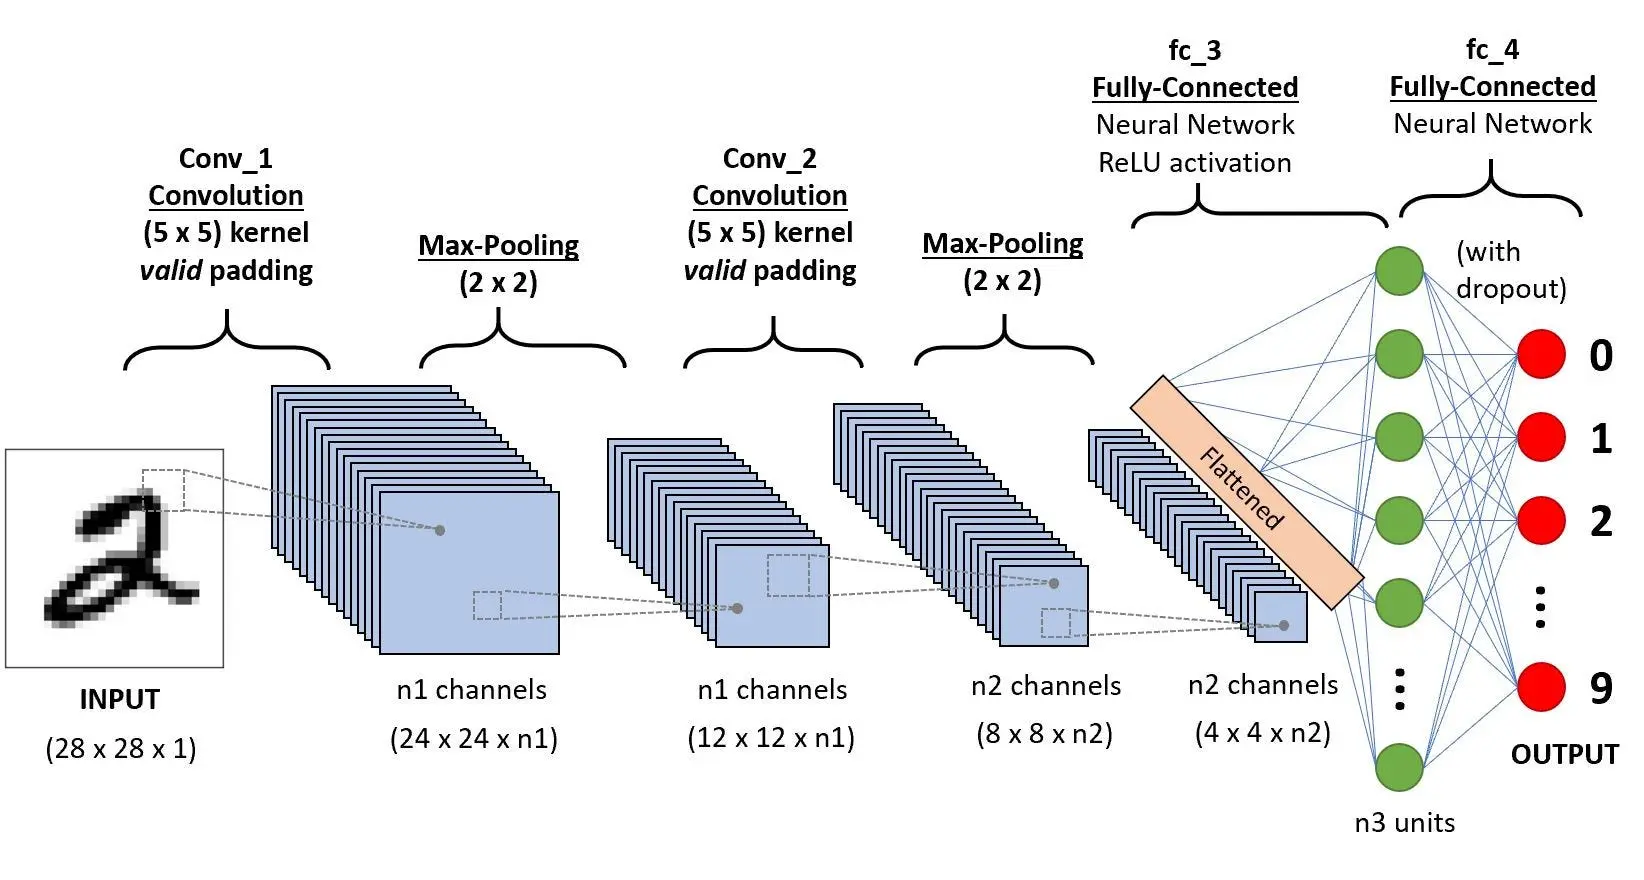
A deep convolutional neural network is trained by feeding it labeled data, adjusting its parameters through backpropagation. The network learns to minimize the difference between its predictions and the true labels, optimizing its ability to classify and recognize patterns in new data.
Reproducing the results
Do you currently think you could re-produce a version of this application, from scratch, on your own?
If this is an example of something you would like to be able to create,then the DSAN program is for you! After graduating from our program, the majority of students would have the required skills to reproduce the ‘Merlin Sound-ID,’ understanding every step of the process, including data collection, pre-processing the data, developing and training a Convolutional neural network to learn to perform the multi-class classification, validating the model to ensure its generality, and finally developing and deploying web-applications to share the model with the world.
The courses in our program that are most relevant to this particular discussion include the following:
DSAN-5000: Data Science and AnalyticsDSAN-5300: Statistical LearningDSAN-5600: Applied Time Series for Data ScienceDSAN-6500: Image Mining and Computer Vision AnalyticsDSAN-6600: Neural Networks and Deep LearningDSAN-6650: Reinforcement LearningDSAN-6700: Machine Learning App Deployment
However, there are many more as well! For a full ‘tour’ of our courses, please refer to our course catalog.
https://analytics.georgetown.edu/program-overview/course-descriptions/
References
- https://merlin.allaboutbirds.org/
- https://www.ducksters.com/science/sound102.php
- https://towardsdatascience.com/machine-learning-types-2-c1291d4f04b1
- https://www.macaulaylibrary.org/2021/06/22/behind-the-scenes-of-sound-id-in-merlin/
- https://www.youtube.com/watch?v=Pkd2Nvv8RRo&t=17s
- voice to text image
