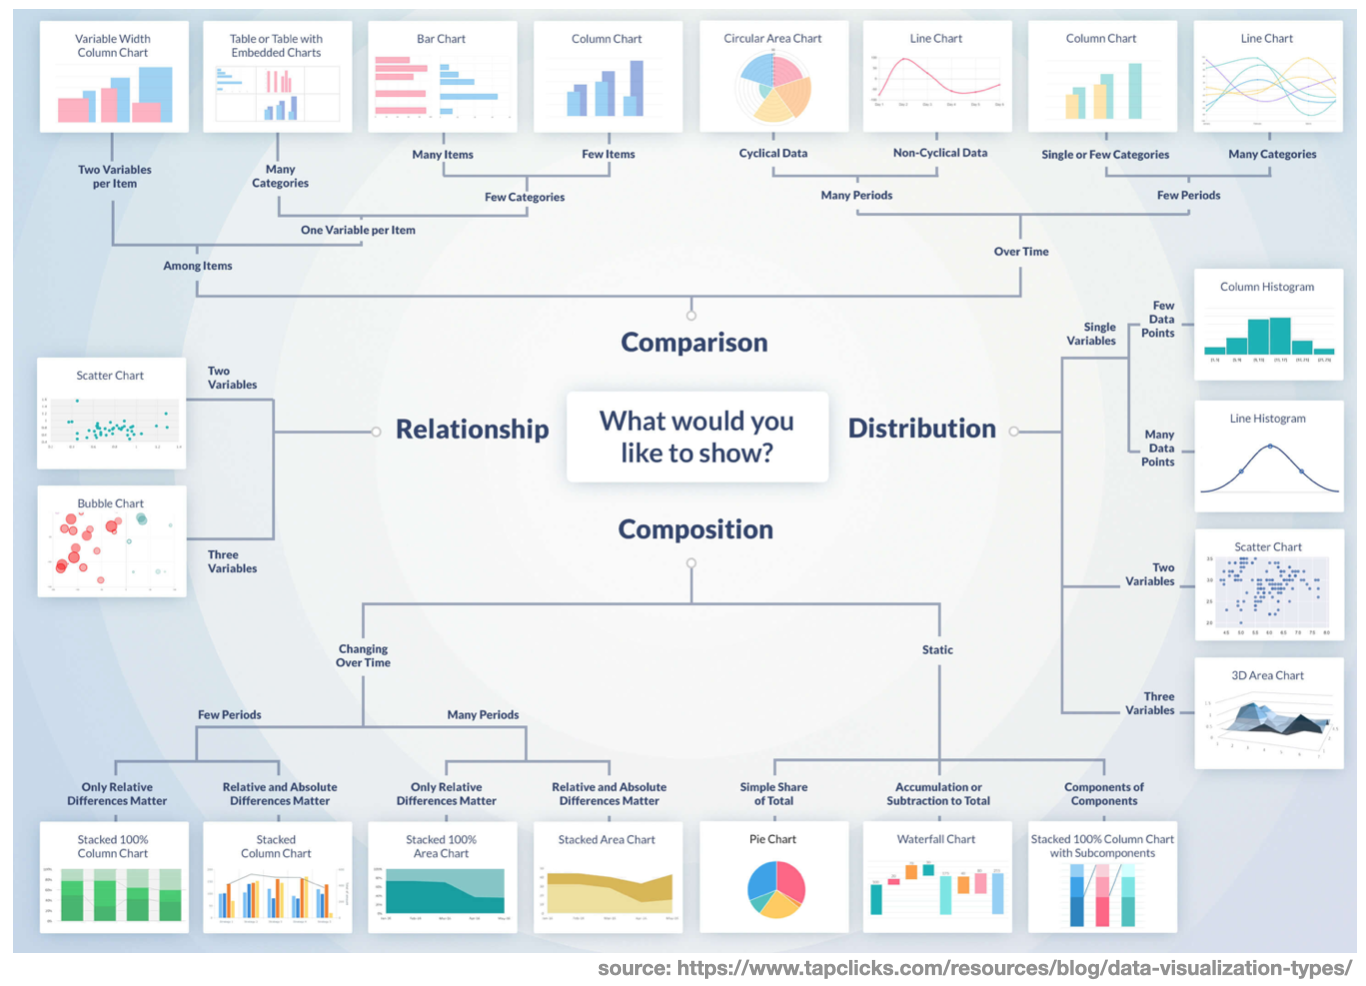
Why is data visualization so important?
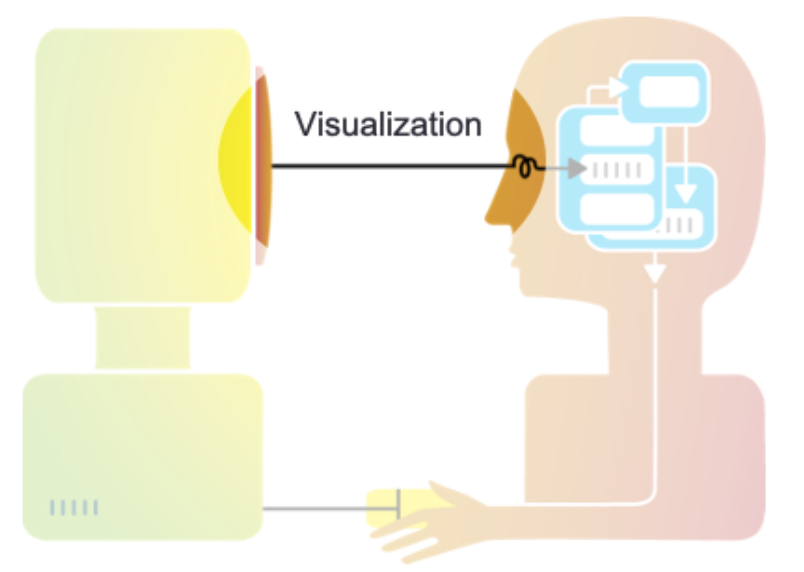
Humans are visual learners
- Most people are inherently visual
- We have a highly developed visual cortex
- Visualizations take advantage of our innate capability to understand visual patterns quickly and intuitively
Like the saying goes:
A picture is worth one-thousand words
Classical data summaries can lie!
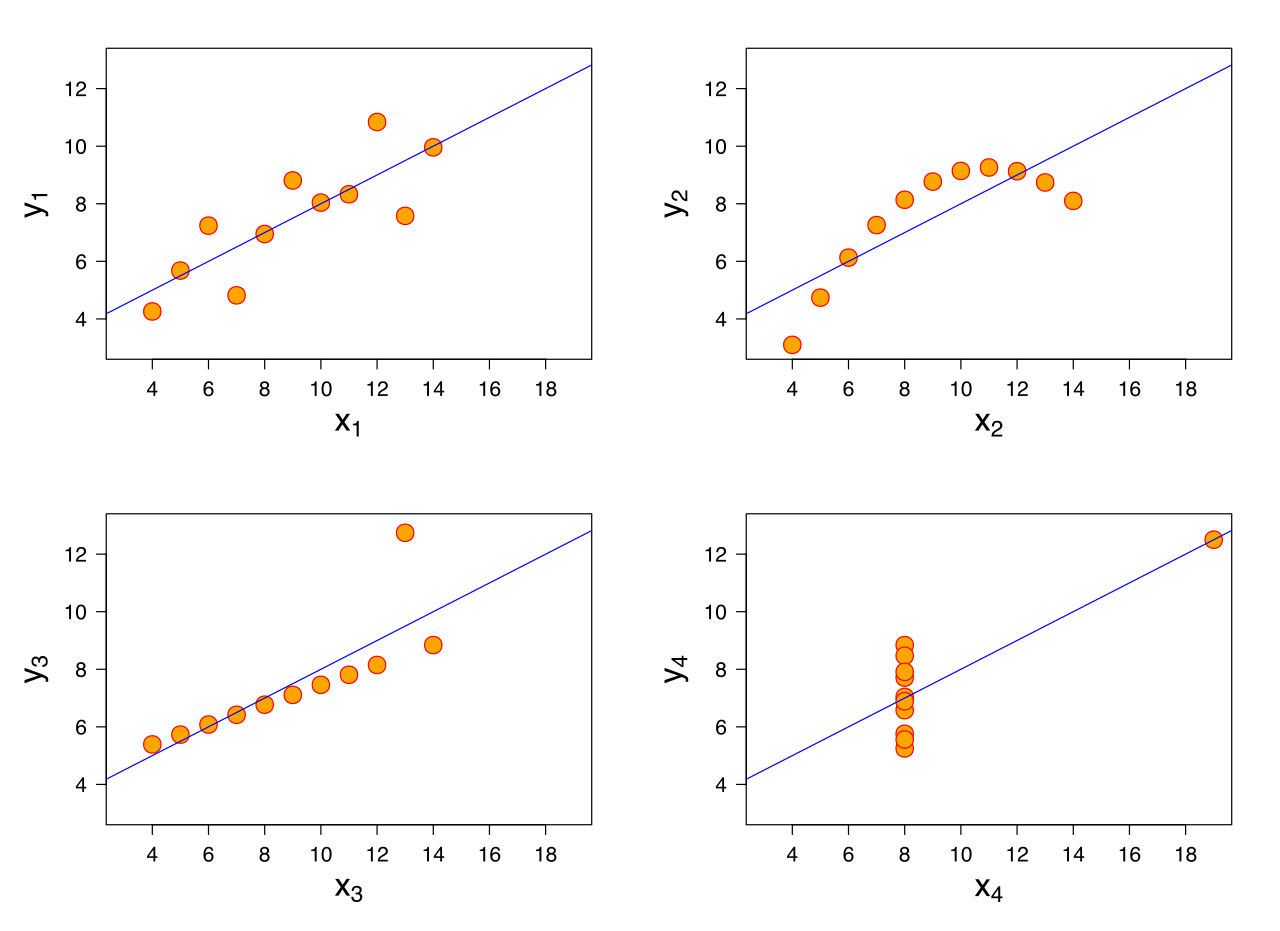
- Assume someone gives you FOUR data-sets (i.e the Anscombe quartet)
- The first thing you typically do is calculate the standard summary statistics:
![]()
- You find that the four data-sets have the same summary stats! However, creating a visualization tells a very different story!
![]()

Remember correlation is not causation
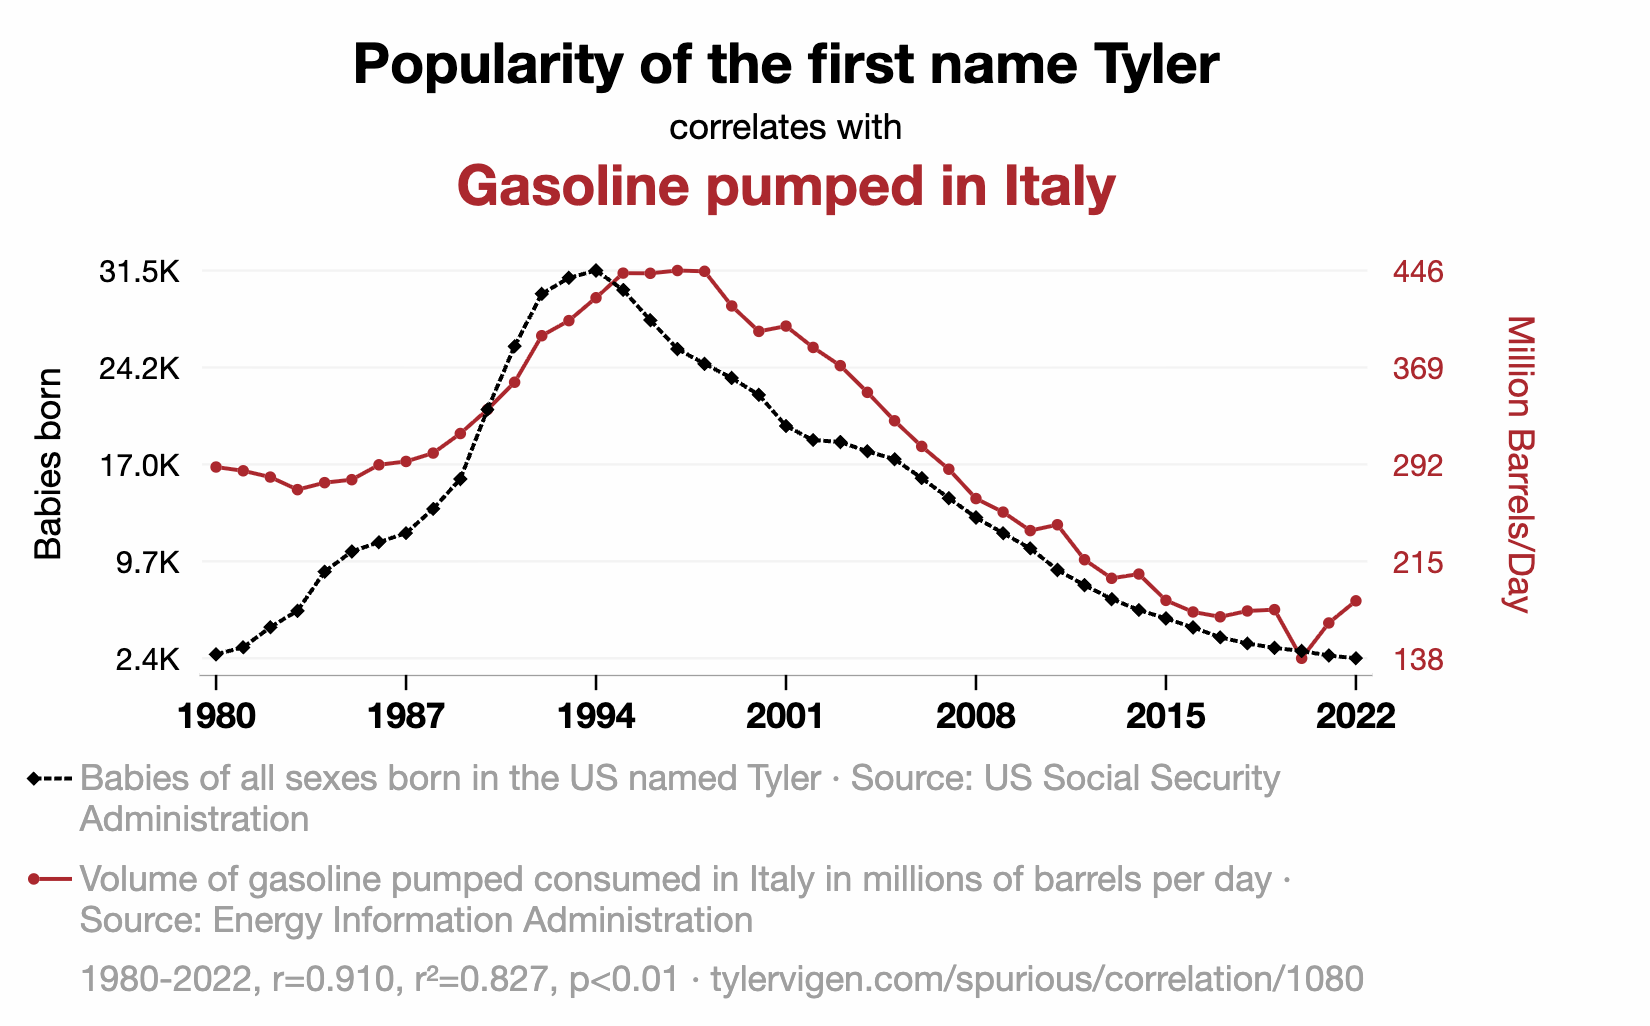
https://www.tylervigen.com/spurious-correlations
Numbers lie (another example)
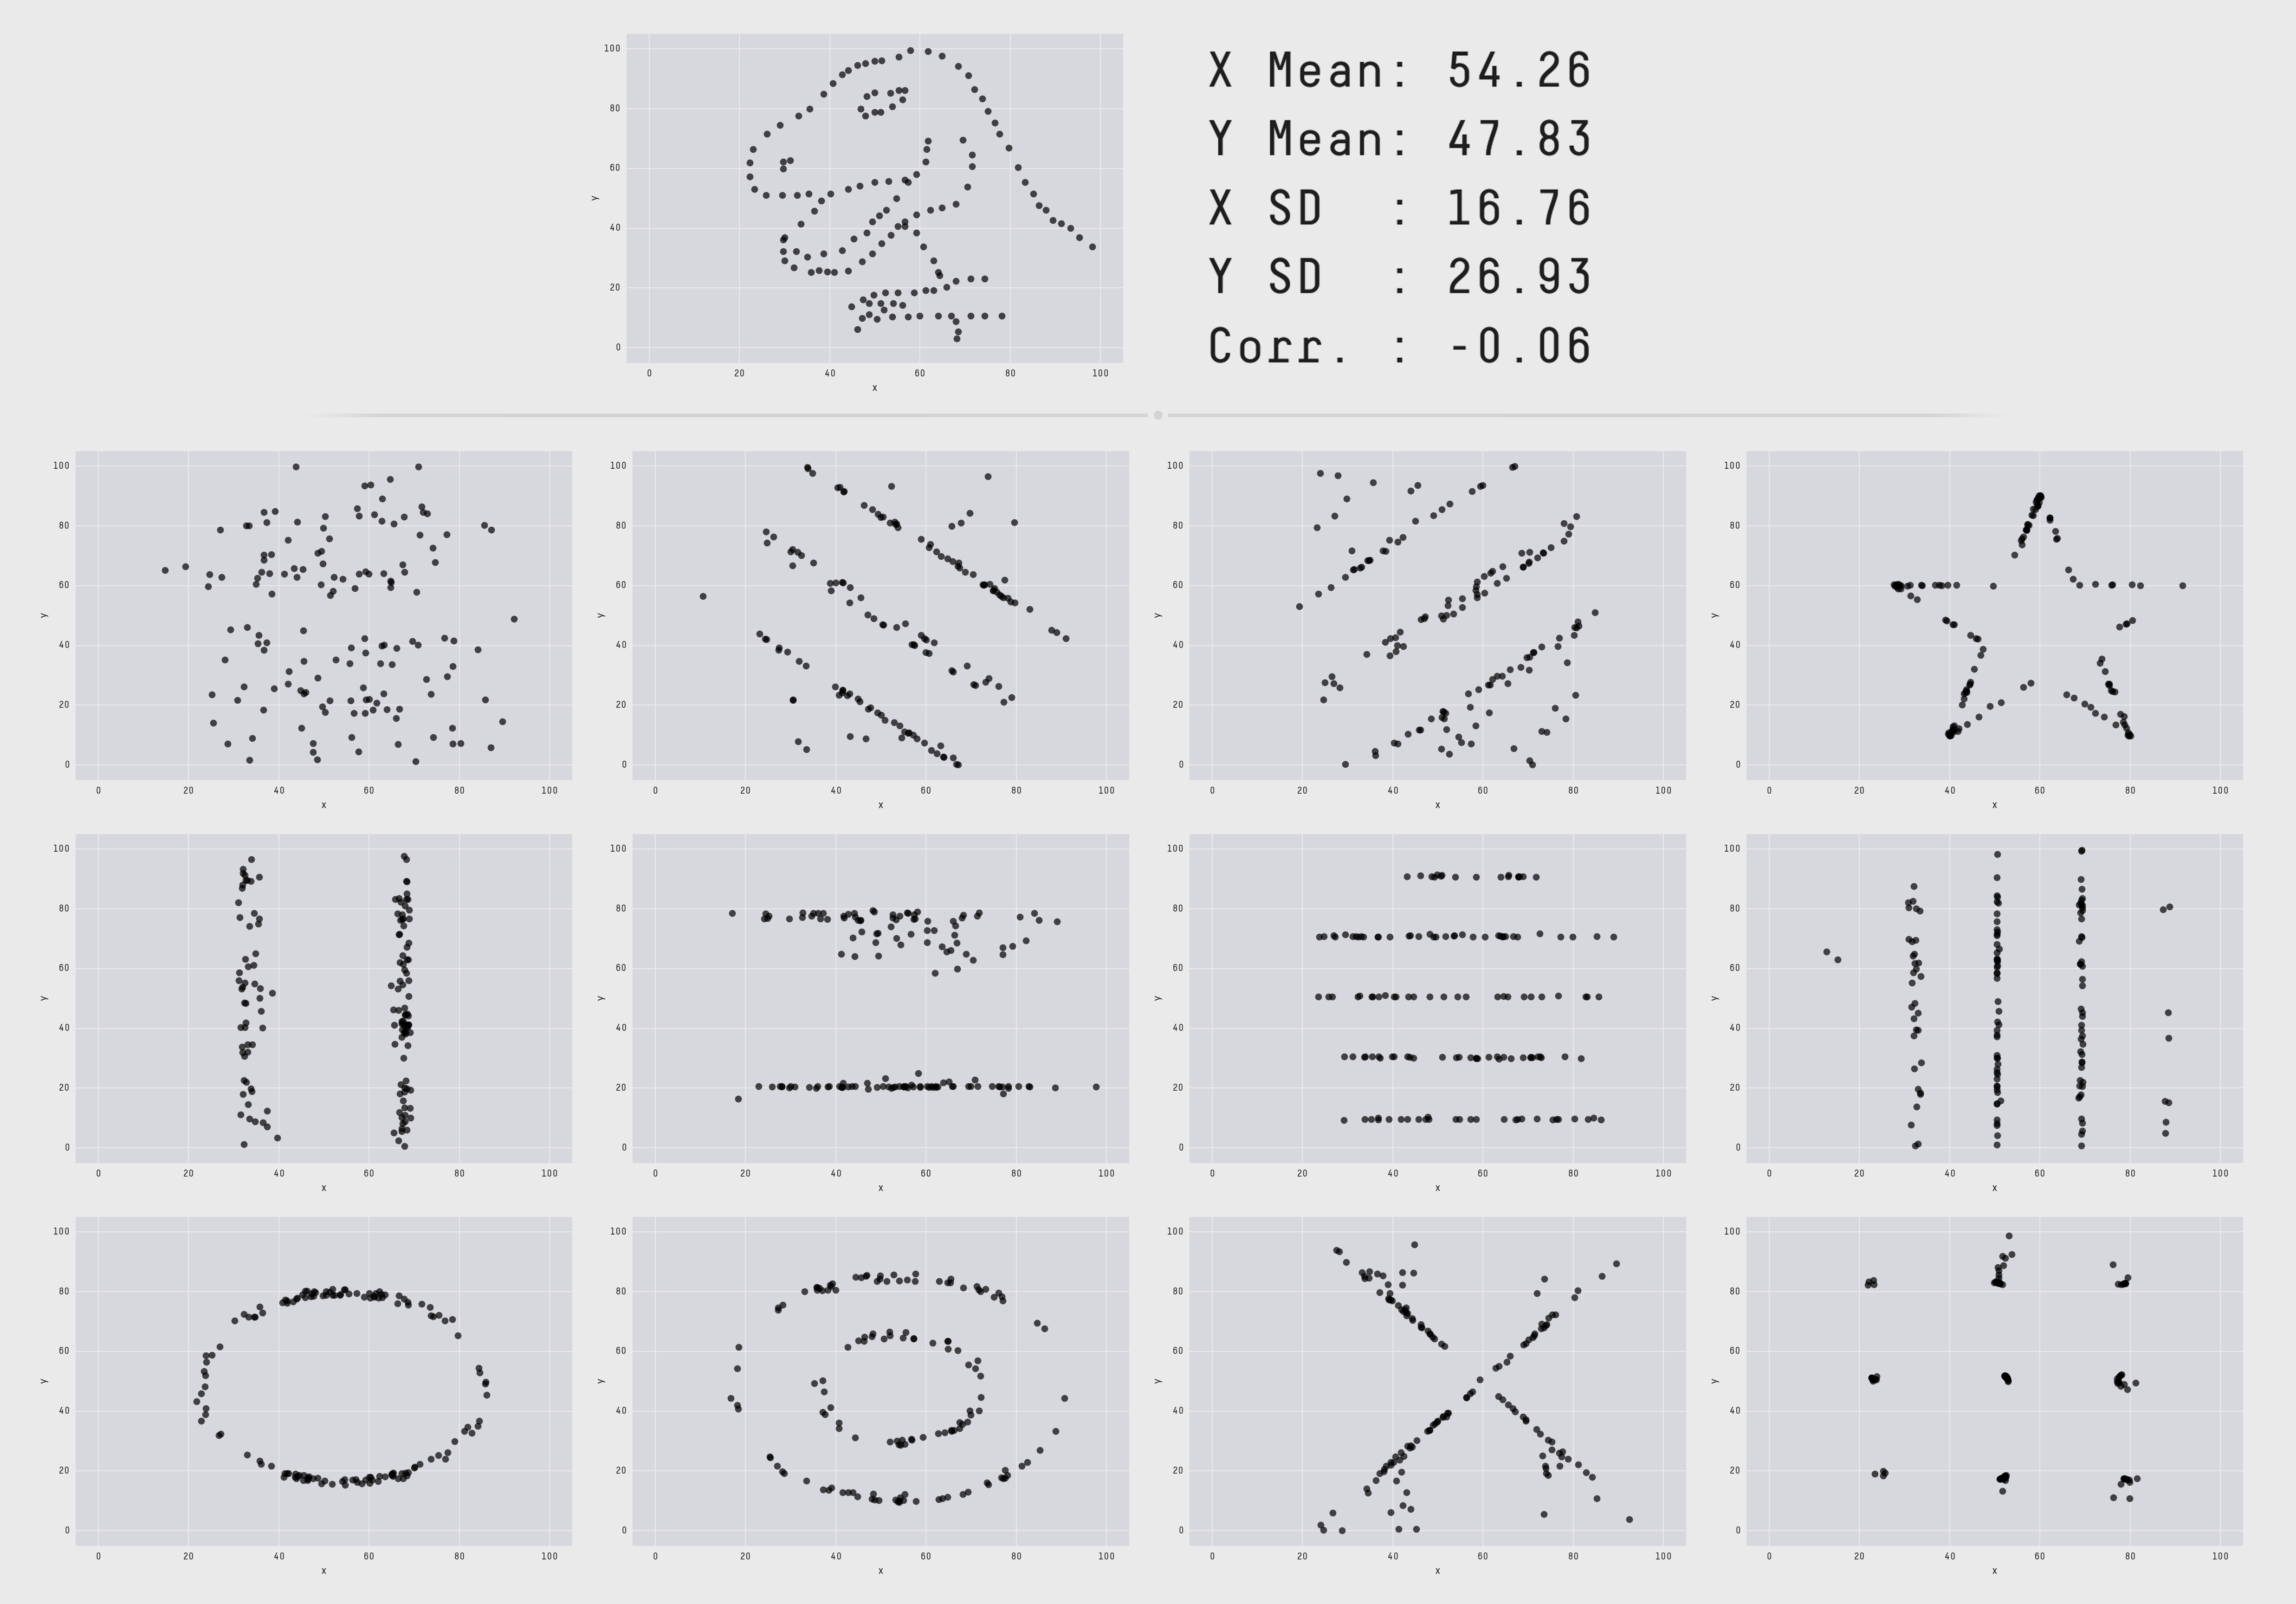
- Here is a similar example, these data-sets all have the same summary statistics!
![]()
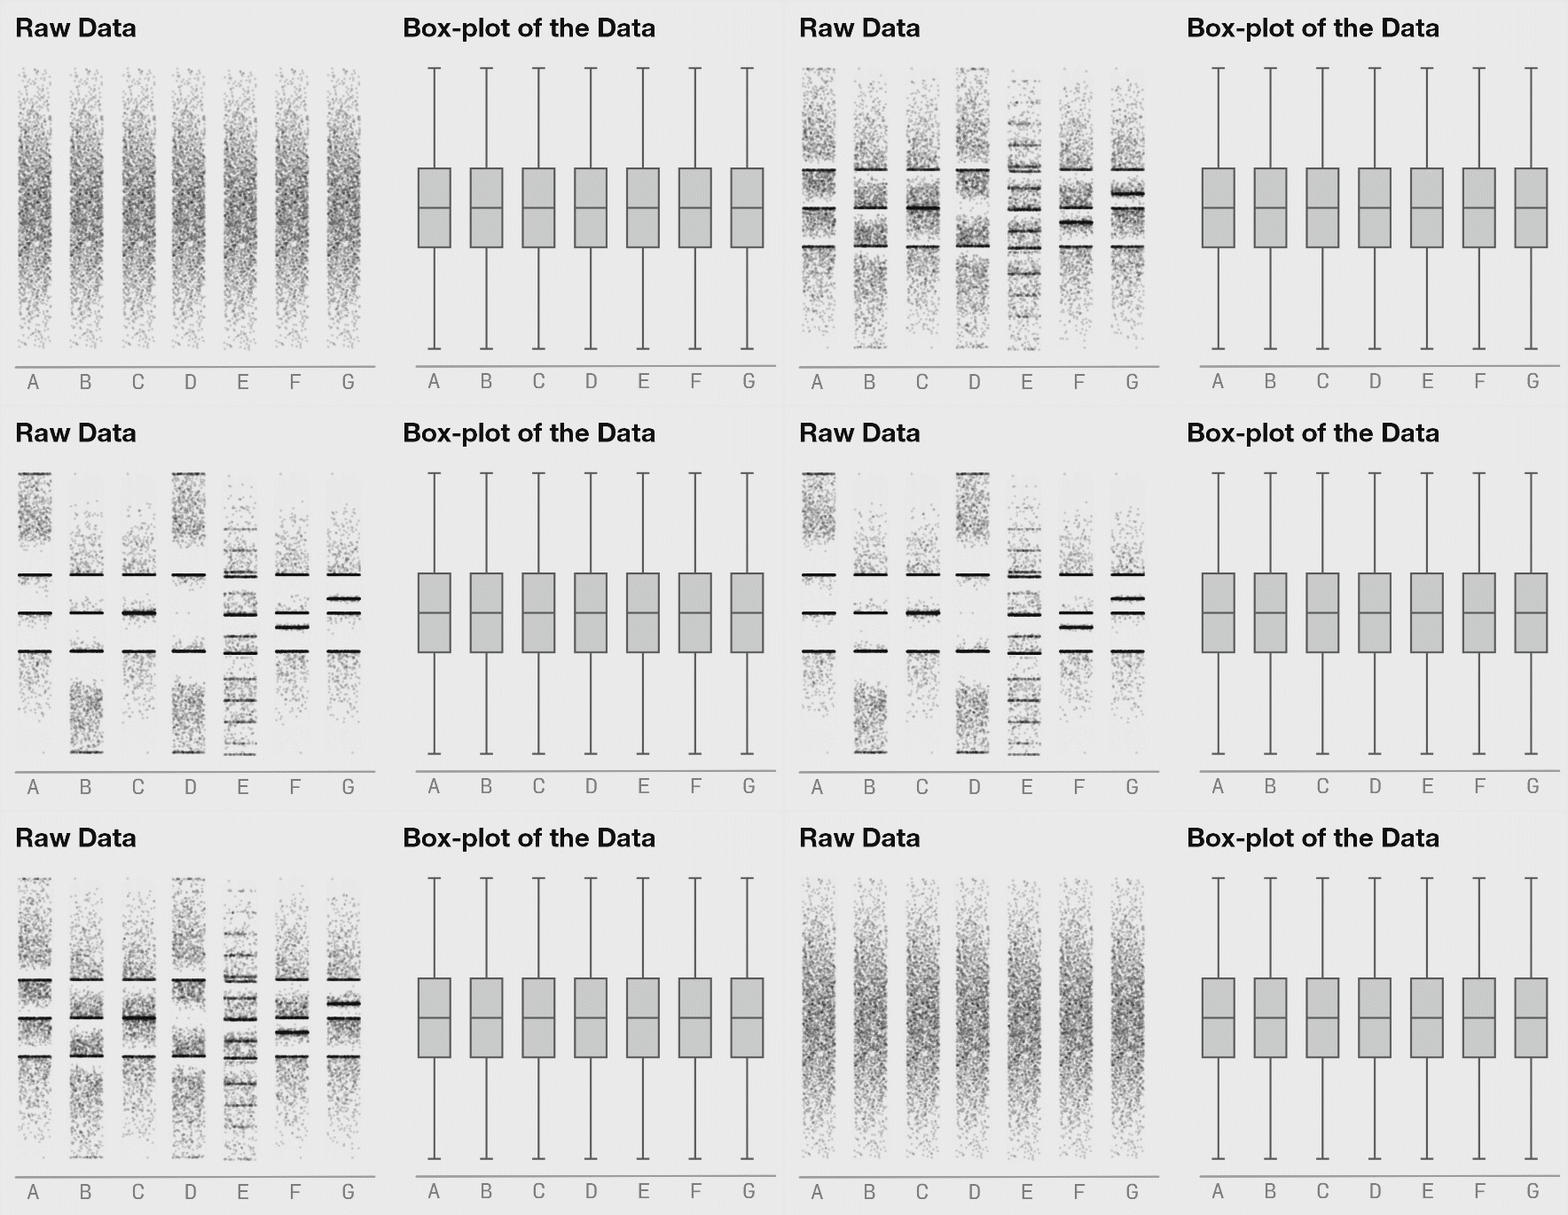
Graphs can lie too!
- Sometimes even graphical summaries can “lie” and some visualizations don’t differentiate.
- This is because box plots are just a visual representation of summary statistics.
Spot trends
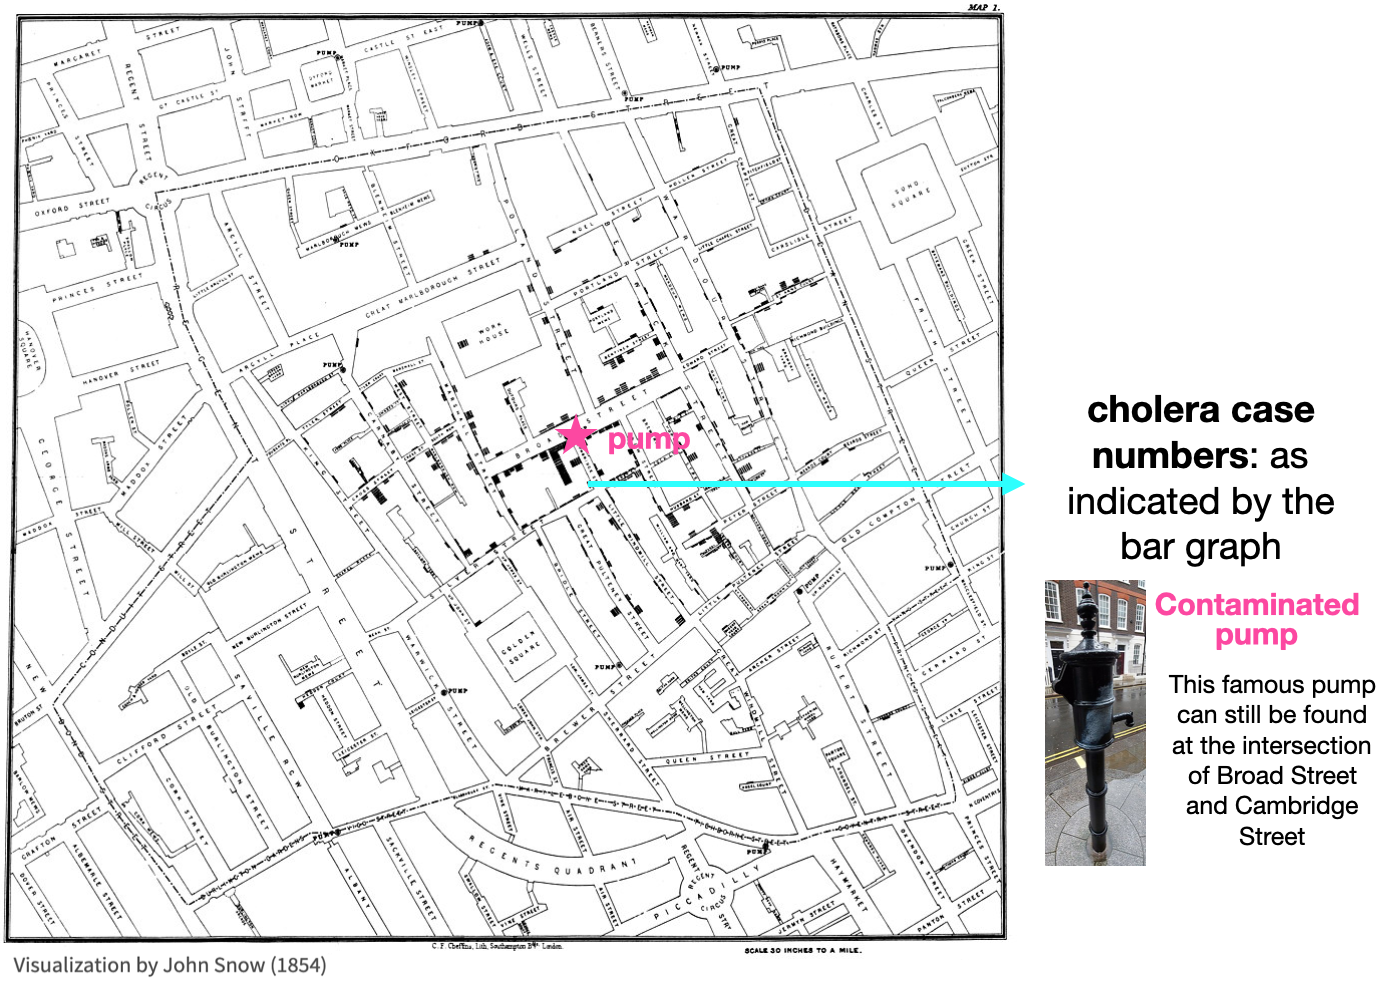
- It is often very hard to see variations (i.e. trends) in raw data.
- On the contrary, a good graph makes picking out trends effortless
- The following is a famous example showing cholera clustering in London
- This creative visualization method helped convince people of the connection between water sources and cholera.
![]()
Spot trends (another example)
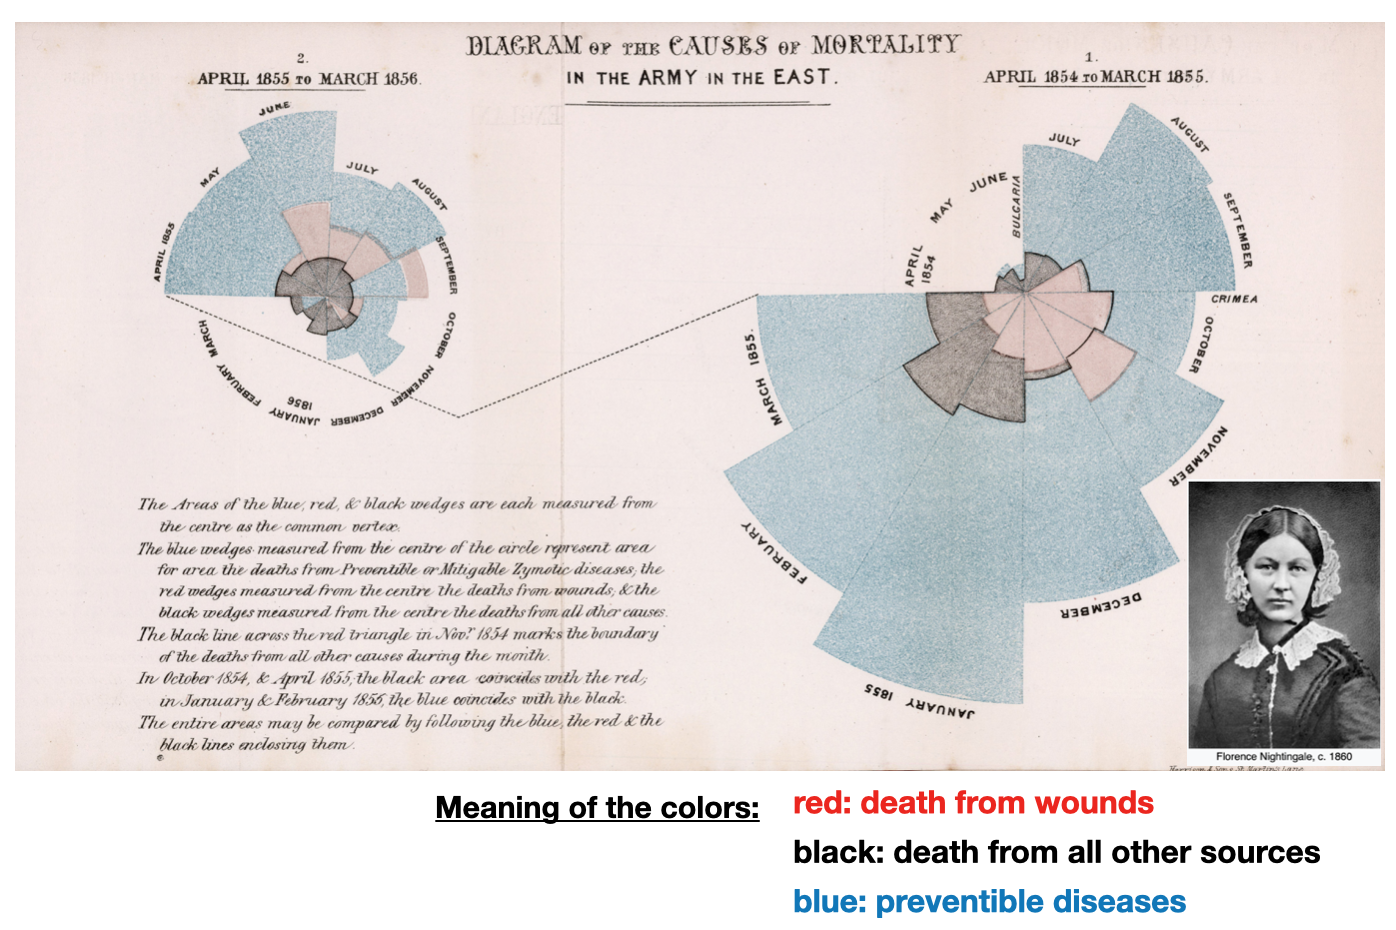
- This is another famous example showing the causes of military mortality in Europe 1
- Notice the creative and intuitive encoding of time and data
![]()
Choosing a model
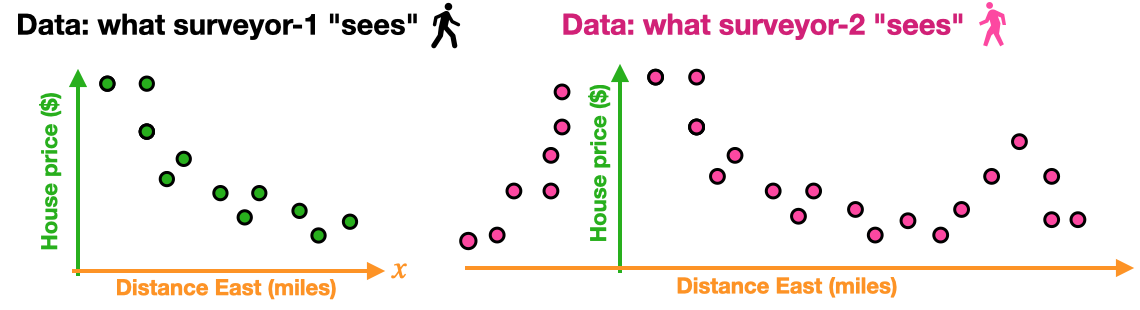
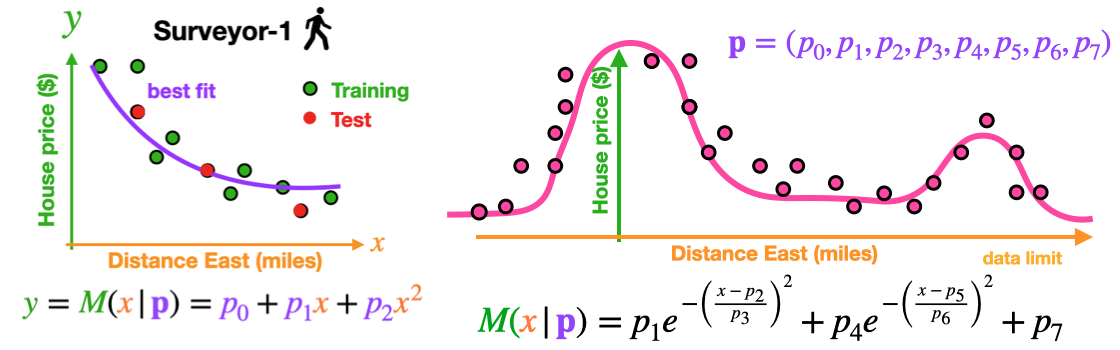
- Consider data on housing prices based on the distance from the center of a city.
- Assume the two surveyors do separate surveys and get different data sets.
![]()
- Clearly, visualization helps us choose the correct model
![]()
Communication: Tell a story
The following is an excellent example of visual story telling (this is also known as the gapminder dataset)
https://youtu.be/jbkSRLYSojo?si=QeyTQTnqgRCabN1Z
Source: https://youtu.be/jbkSRLYSojo?si=QeyTQTnqgRCabN1Z
Note: We will re-create this visualization later in the class
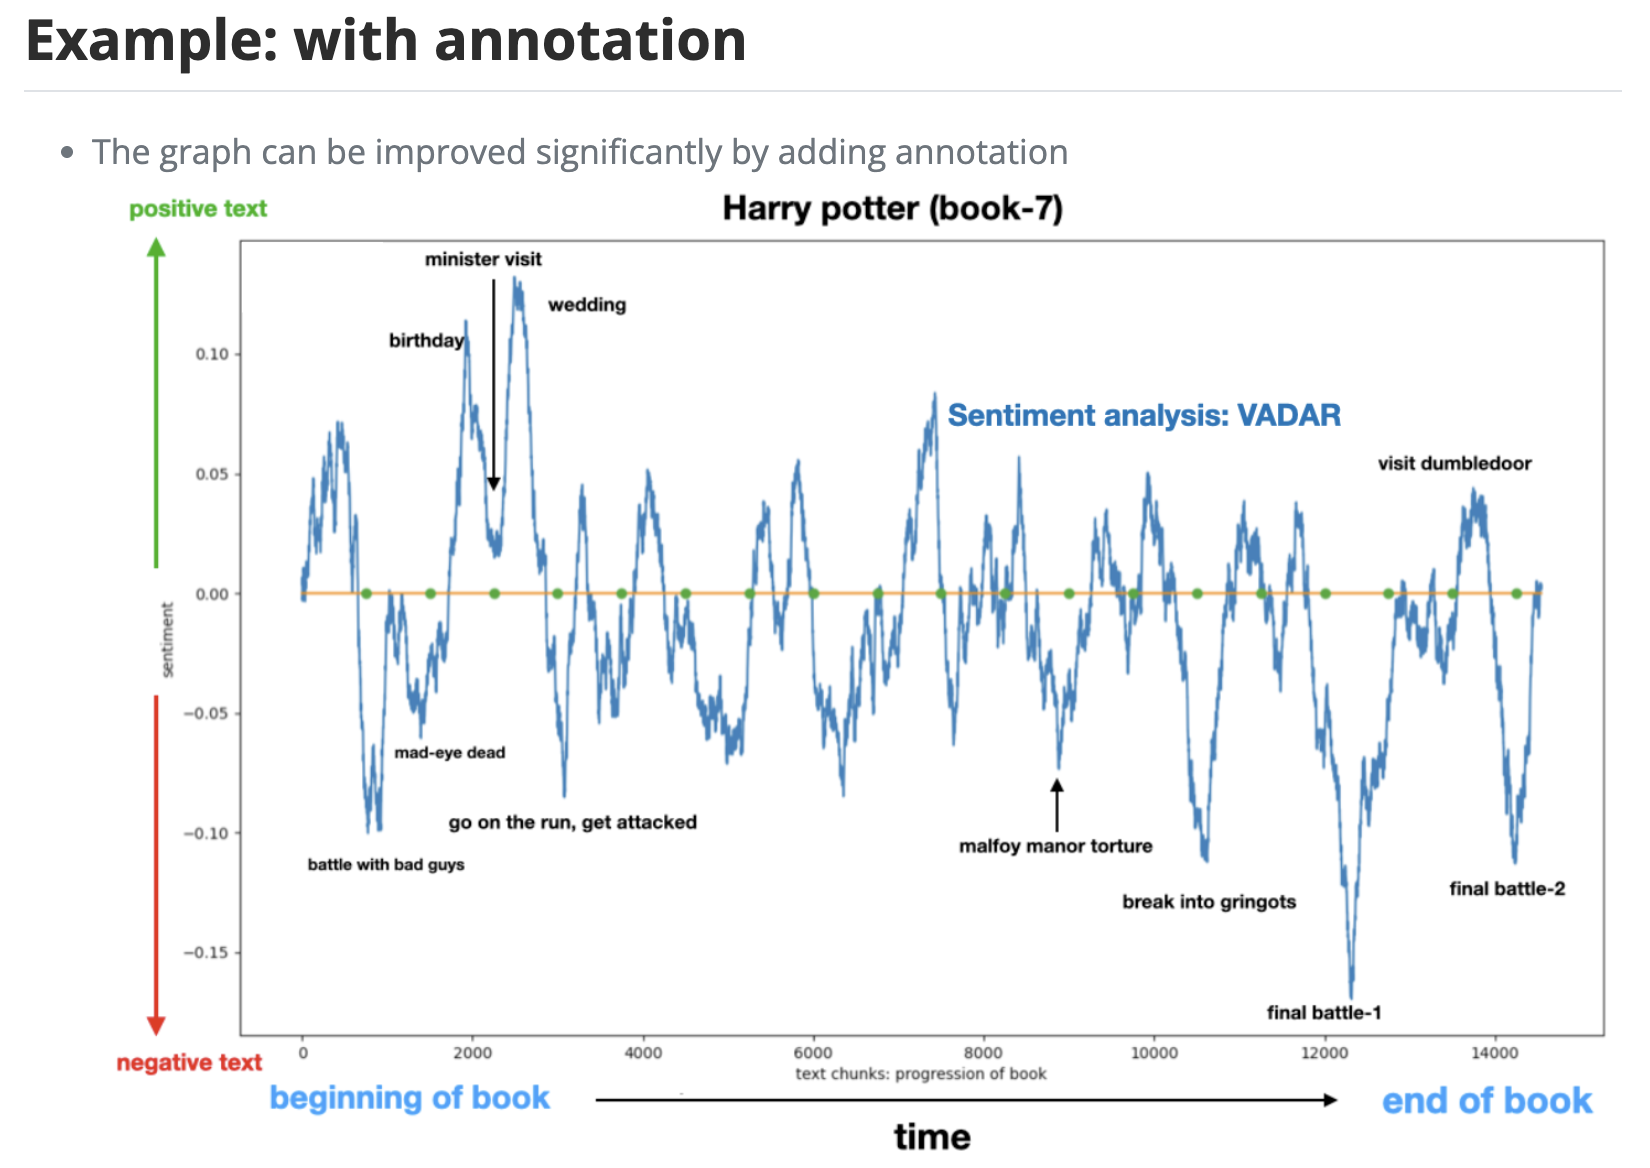
The grammar of graphics makes it easy to apply these guidelines
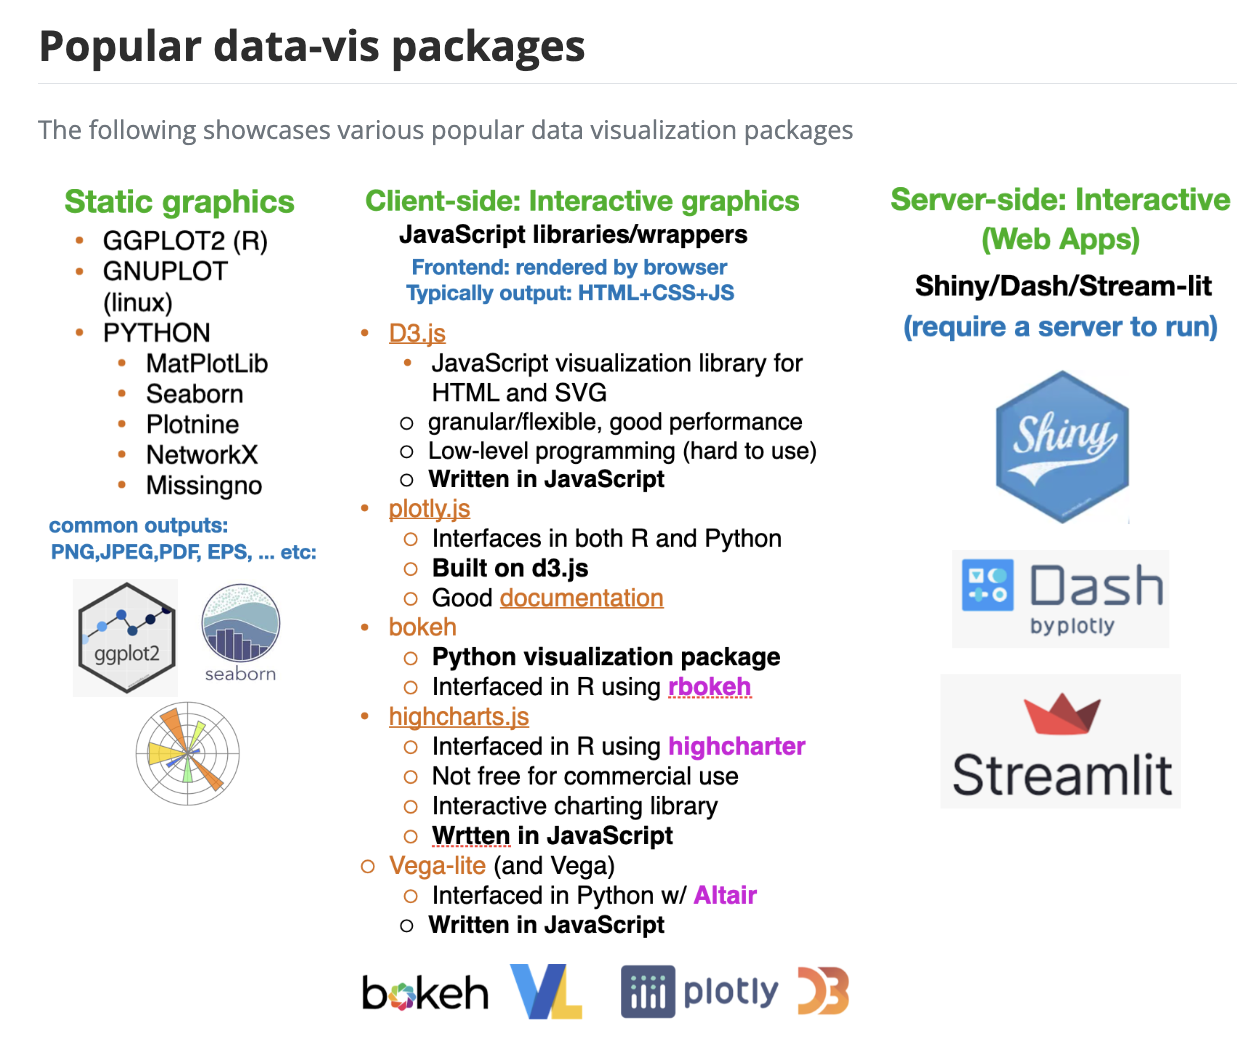
Historical context
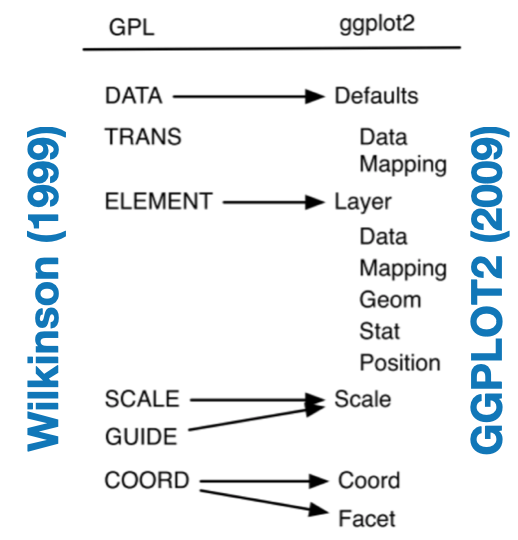
1994: William S. Cleveland, The Elements of Graphing Data, lists the “basic elements of graph construction” as scales, captions, plotting symbols, reference lines, keys, labels, panels, and tick marks.
1999: L. Wilkinson’s book The Grammar of Graphics defines ‘components of a graphic’:
- Structured framework utilizing a layered approach to describe and construct visualizations
2009: ggplot2: Elegant Graphics for Data Analysis, Book by Hadley Wickham.
![]()
What is it?
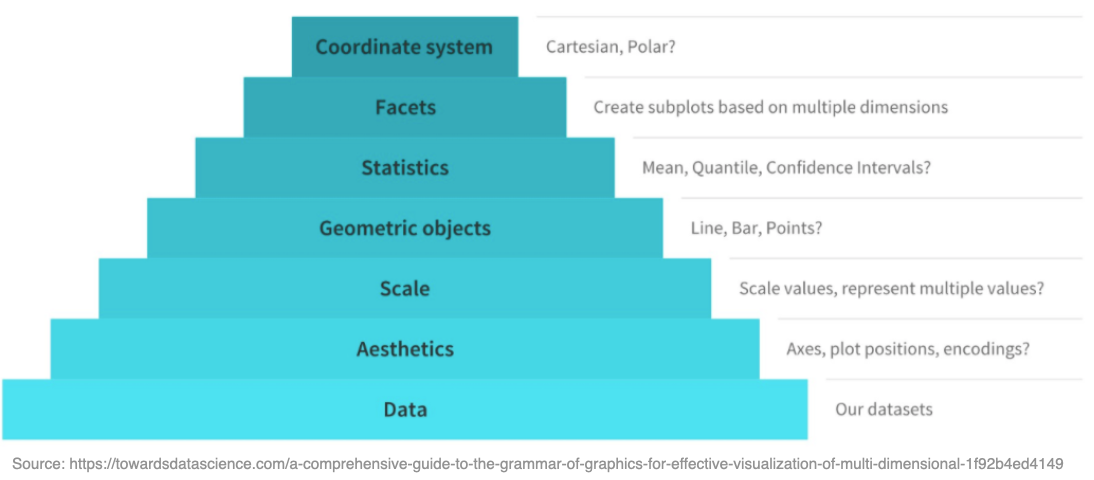
- The Grammar of graphics is a conceptual framework for thinking about graphics
- It provides a hierarchy of elements to deconstruct and understand figure design
![]()
Example
- The vector graphics discussed last week are a good example of this
- They clearly demonstrate the hierarchy and layered structure of graphics
- i.e. A blank canvas with elements and structures added on top
![]()
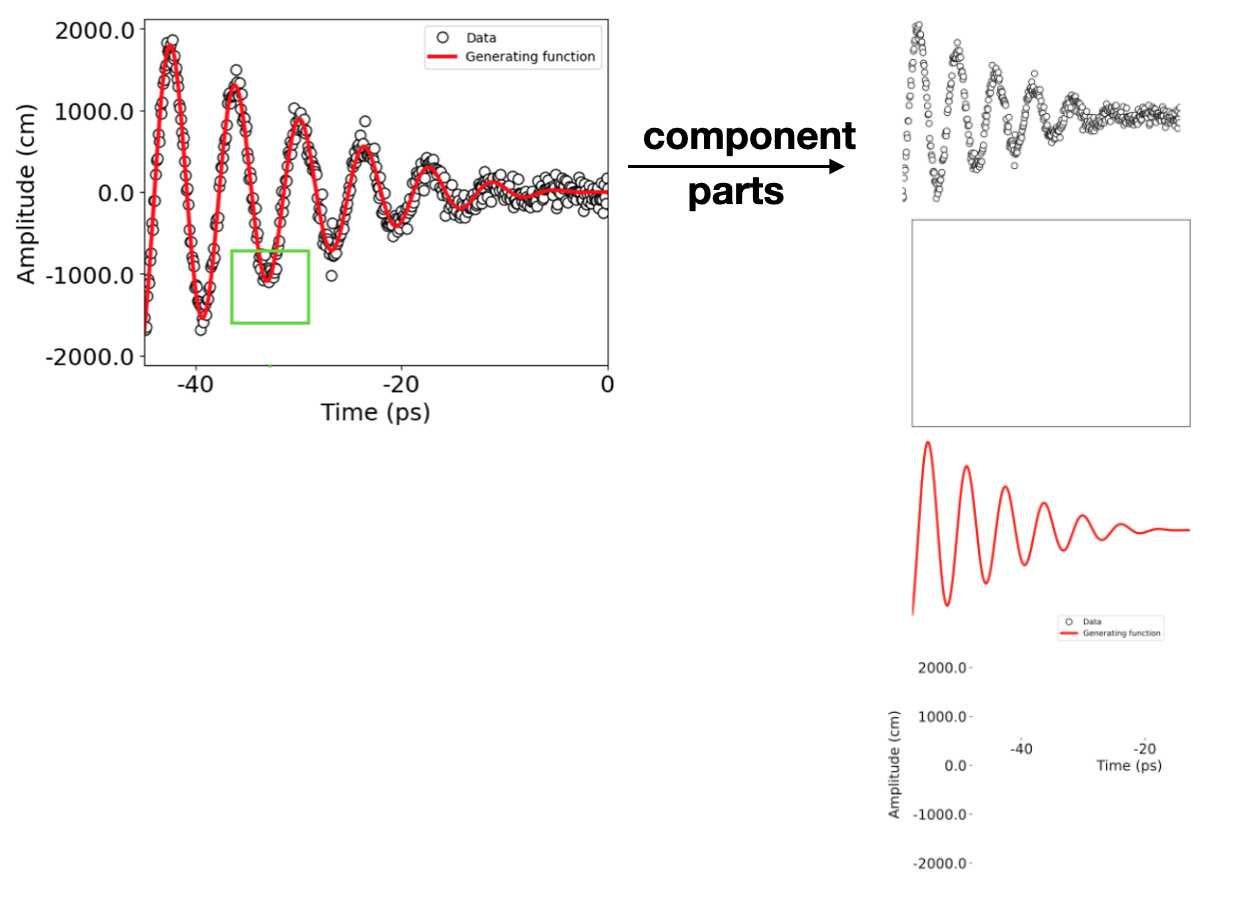
Another example
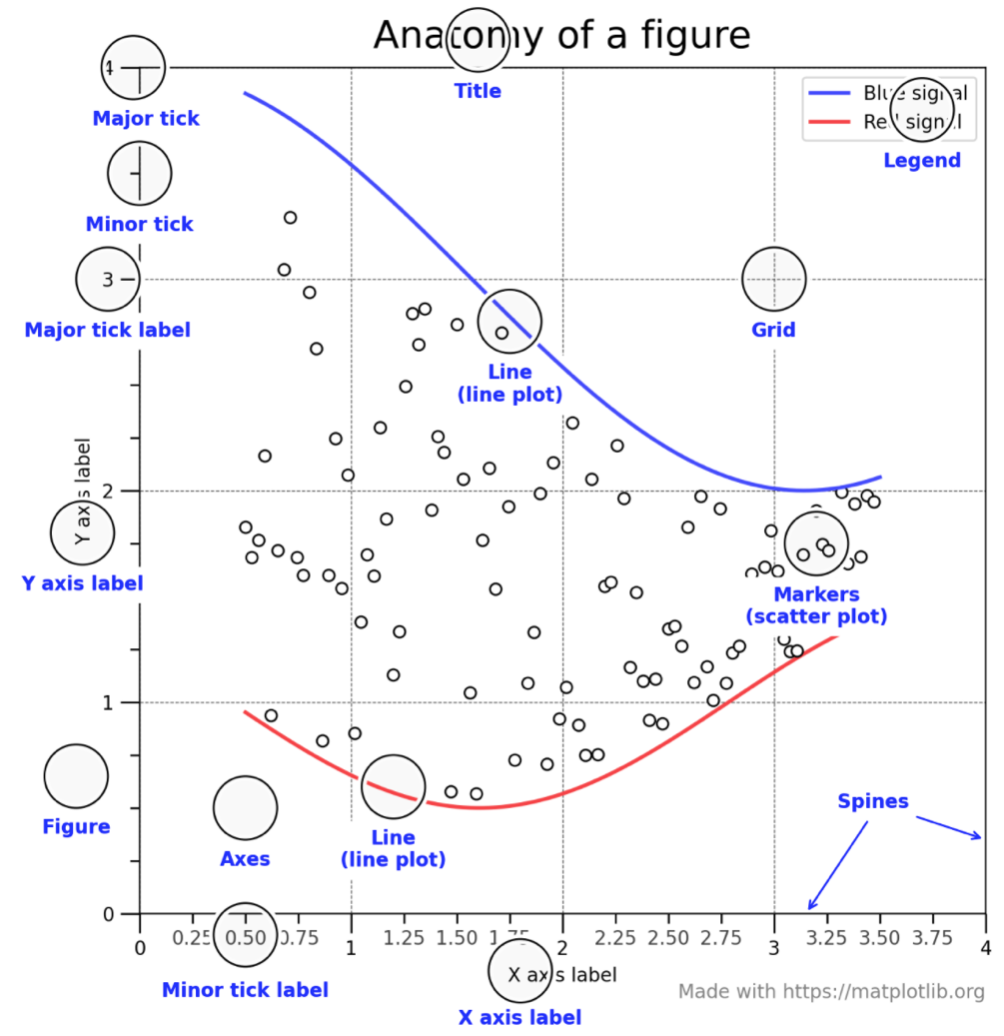
Encoding and perception-1
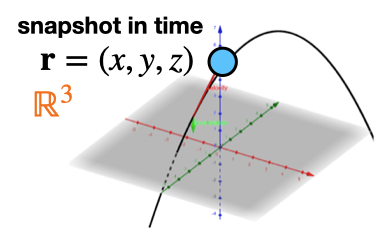
How do we visually perceive the world?
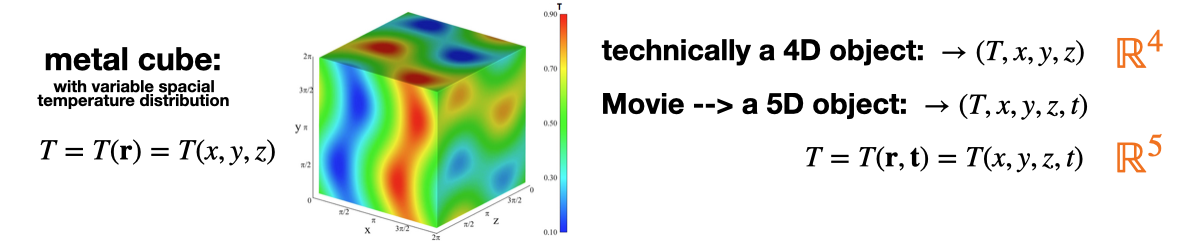
- Length/distance: 3 spatial dimensions (x,y,z).
![]()
- Length/distance: 3 spatial dimensions (x,y,z).
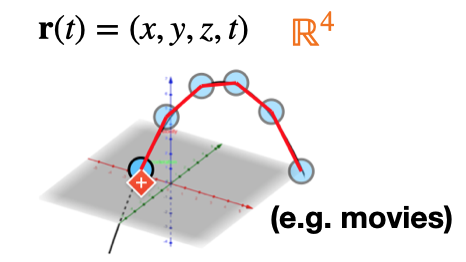
- Time: one temporal dimension (t).
![]()
- Time: one temporal dimension (t).
Encoding and perception-2
- Color and intensity: We can visualize a another scalar dimension with color
![]()
- Color and intensity: We can visualize a another scalar dimension with color
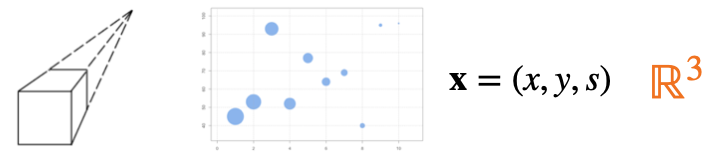
- Depth perception: We can also visualize a scalar dimension with size/depth
![]()
- Depth perception: We can also visualize a scalar dimension with size/depth
Encoding methods
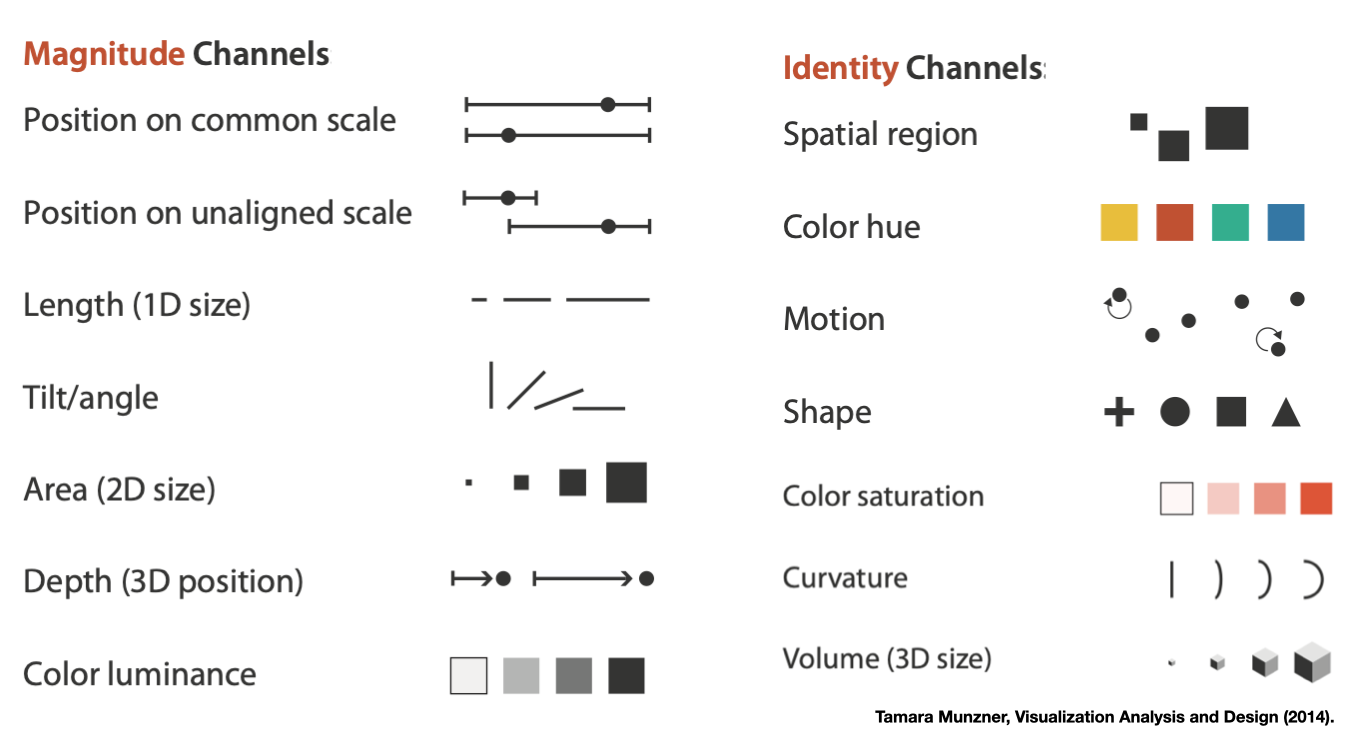
- Visual encoding is the representing numerical data in a way humans can understand.
![]()
- All visualizations use some combination of these encoding methods
![]()

Graphical building blocks
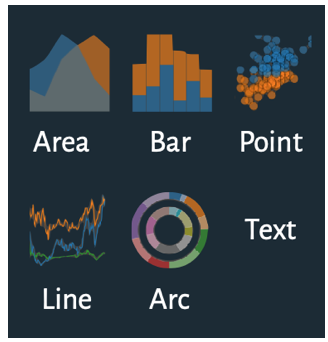
- Nearly all digital graphical objects are built from the following fundamental constructs
![]()
- This becomes especially important for interactive graphics
- Interactive Java-script libraries (D3, plotly, etc) build visualizations piece by piece from these fundamental objects, in the form of SVG HTML objects (more on this later).
![]()

Bar-charts
- Length is most commonly used in the context of bar charts.
- The longer a bar is, the greater the value
- Note: Don’t truncate bar charts, use length in its entirety! \(\,\)
![]()
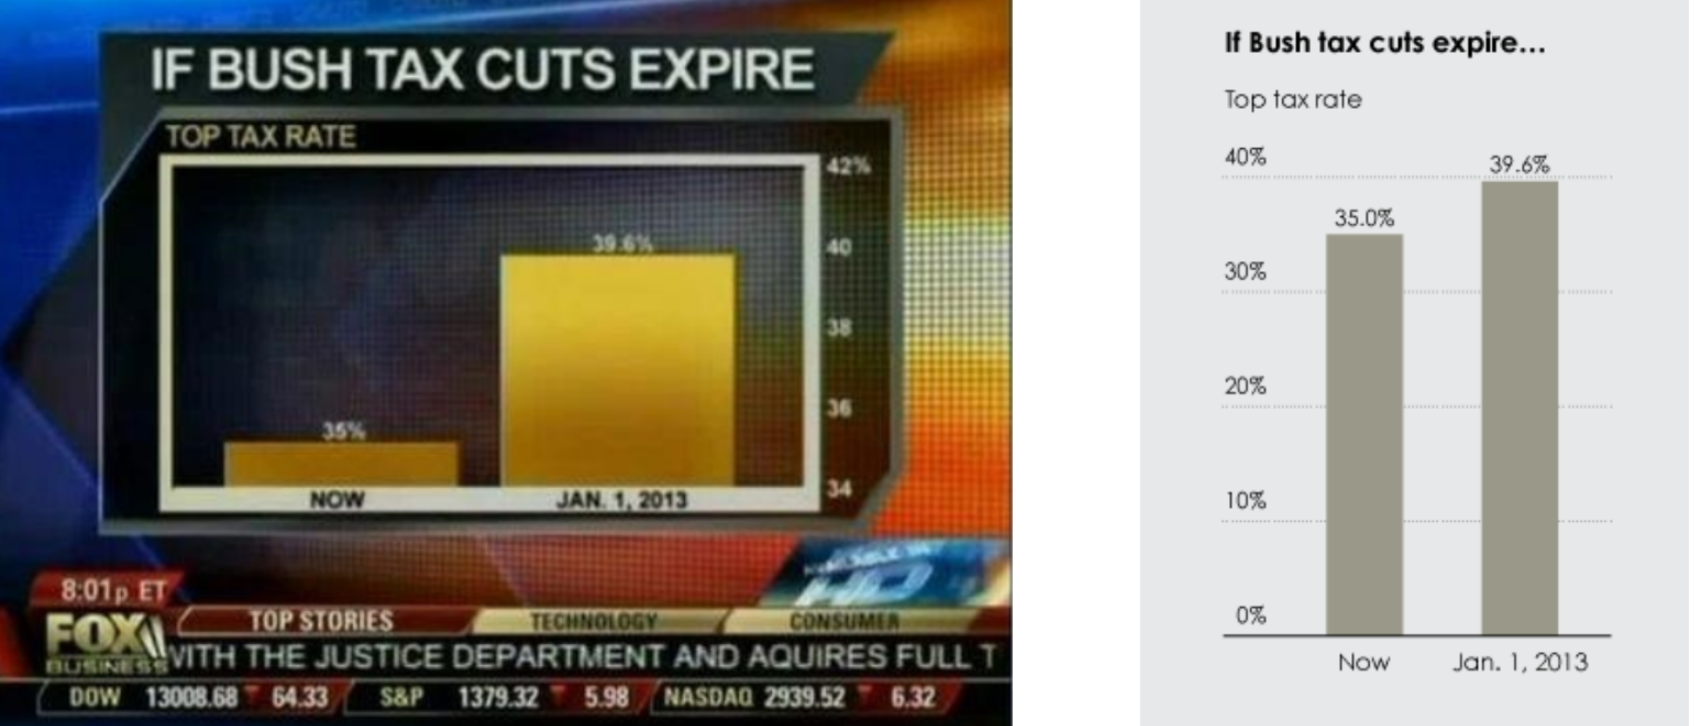
Omitting the baseline
- Only showing the top of a bar-graph is a method of “graphical mis-representation” known as “omitting the baseline”. In most cases the baseline should be zero.
![]()
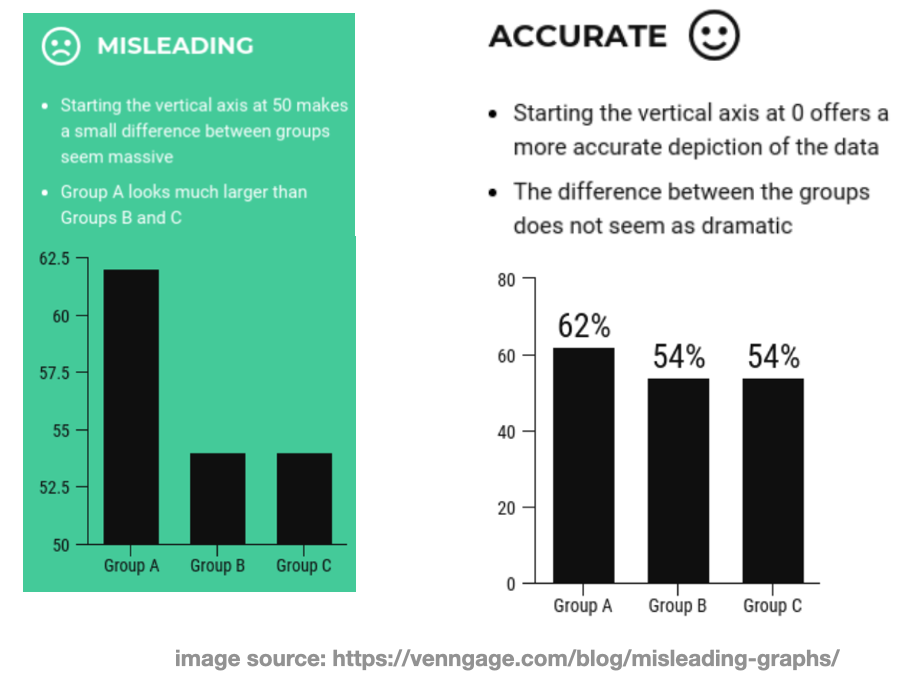
Example-1
- Note: Always make sure the variation in length is directly proportional to the variation in the data. Other-wise the encoding is not an accurate representation of the data.
![]()
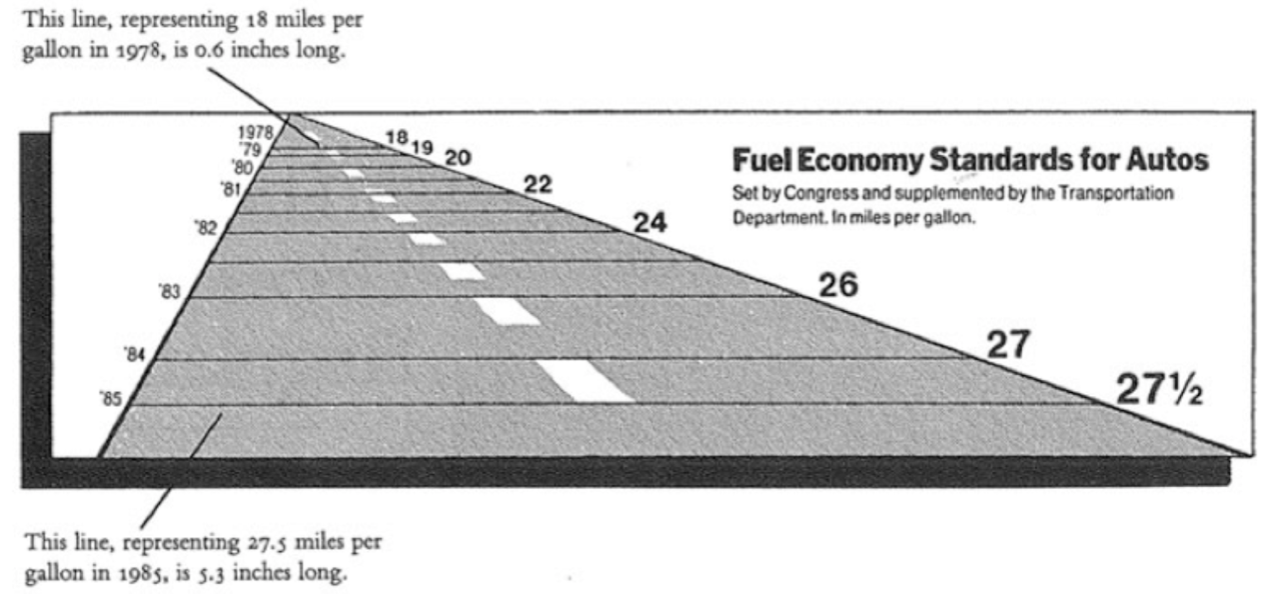
Example-2
- The following is another example of dis-proportionate length encodings \(\,\)
![]()
- They aren’t always intentional or malicious, sometimes it is just bad visualization
- Being aware of these things is a form of data literacy, it is an important skill
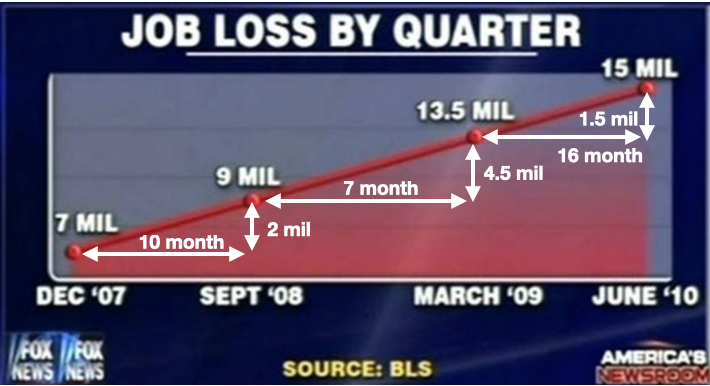
Overview
- Position allows comparison of values based on placement in a coordinate system.
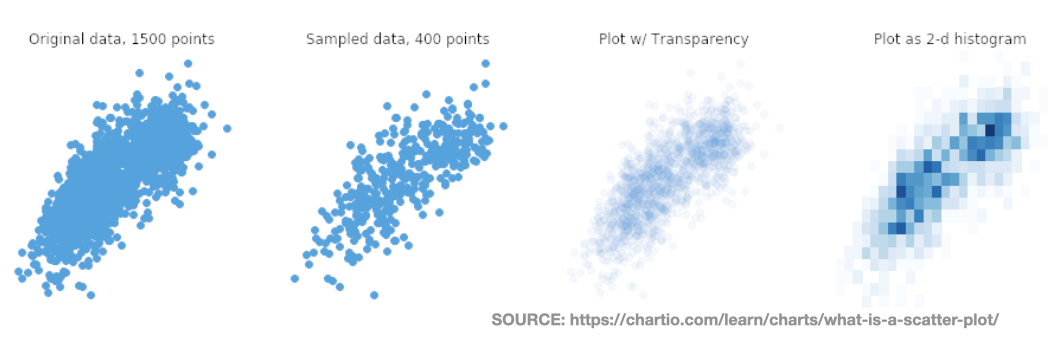
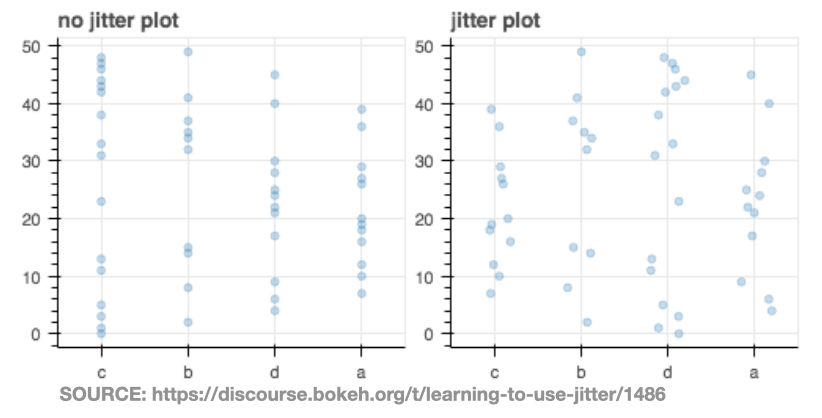
- Avoid over-plotting, points can occupy the same space and obscure each another
- Solution-1: Transparency or binning.
![]()
- Solution-2: Jitter is adding noise to remove overlap.
![]()
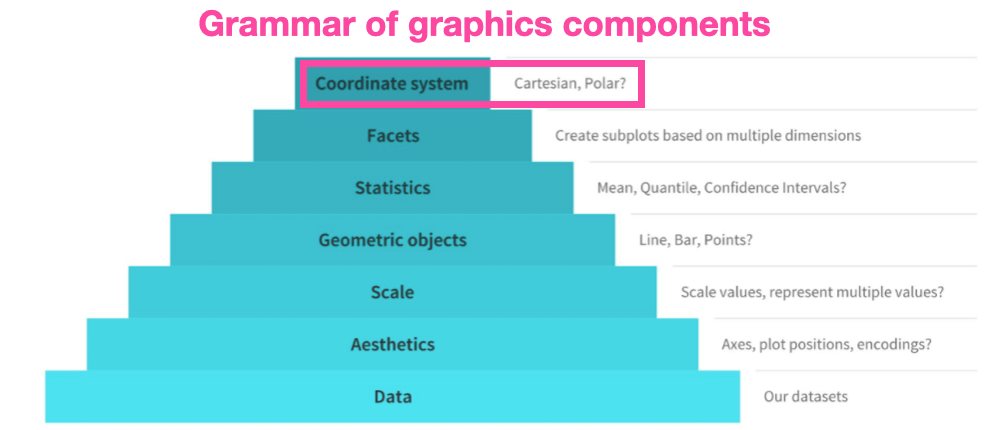
Coordinate systems-1
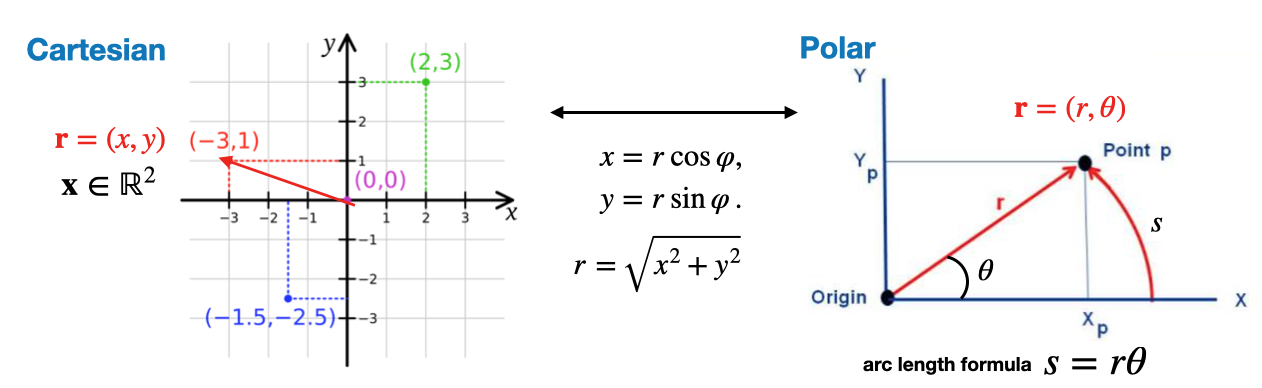
- The optimal coordinate system depends on the underlying structure of the data
- Most of the time we can safely stick to the Cartesian system
- Two dimensional coordinate systems:
![]()
Coordinate systems-2
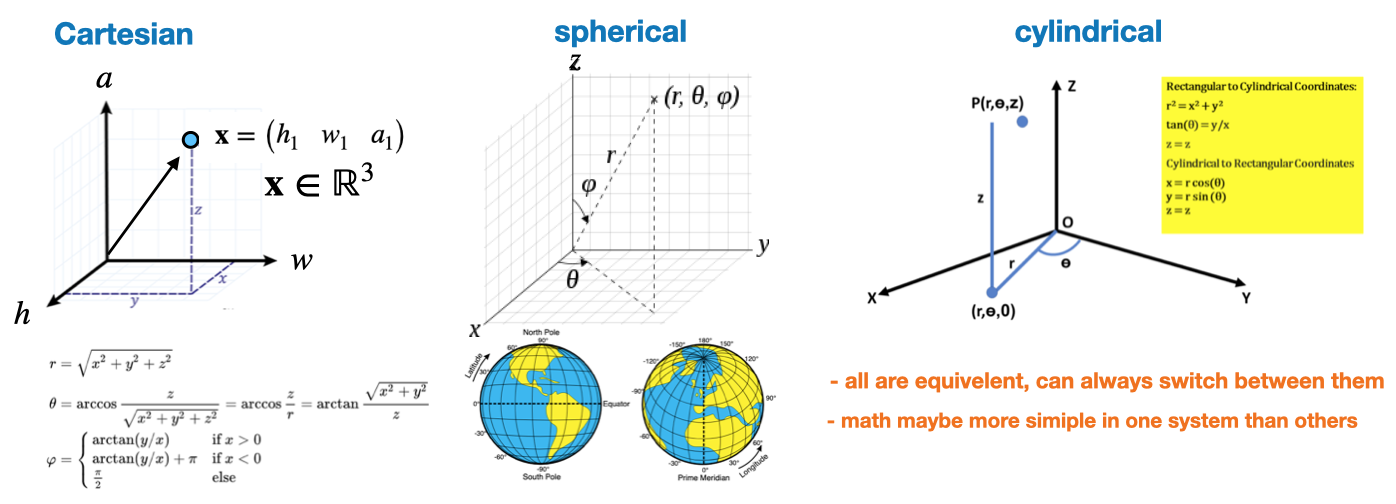
- These are options for visualizing data in three dimensions \(\mathbf x=(x,y,z)\)
![]()
- The choice of coordinate system is an important component of any chart \(\,\)
![]()
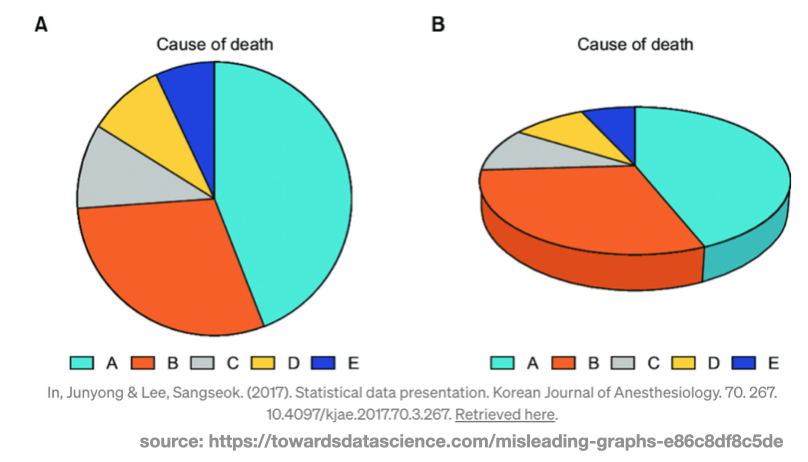
3D Graphics
- Typically it is good to avoid 3D visualizations in favor or 2D ones
- The third dimension projected onto a 2D surface can introduce artifacts by throwing off proportions
- They have a tendency to make things look larger or smaller depending on their angle.
![]()
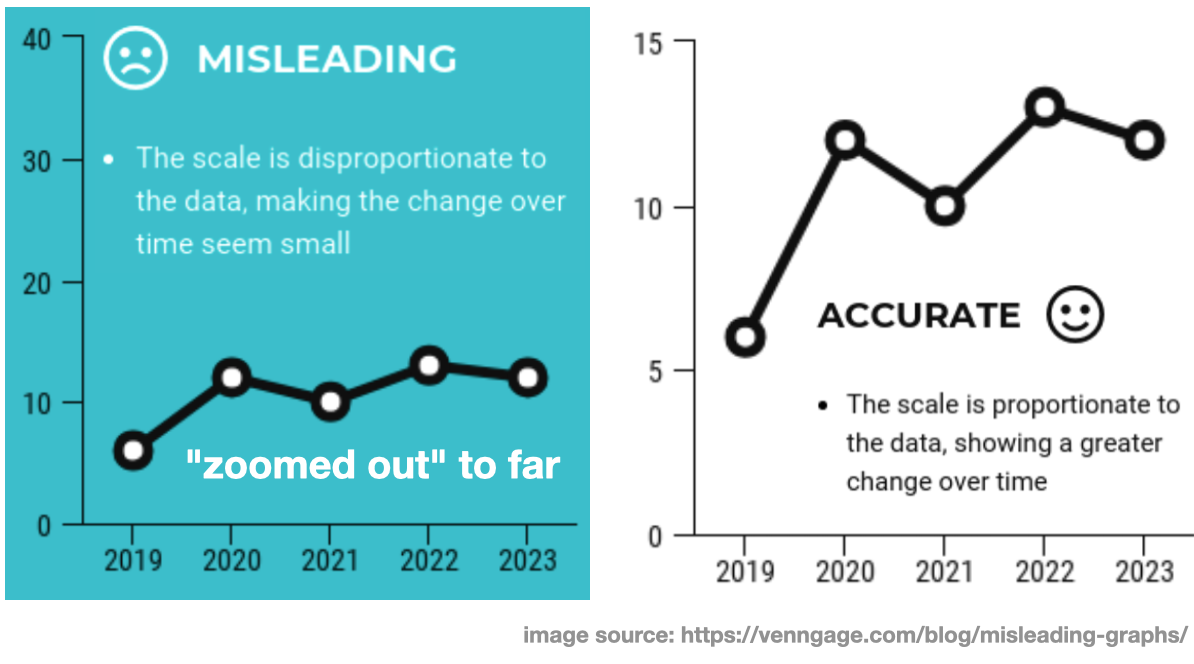
Manipulating the y-axis
- Note: Don’t manipulate the coordinate axis bounds to mis-represent or distort the data
![]()
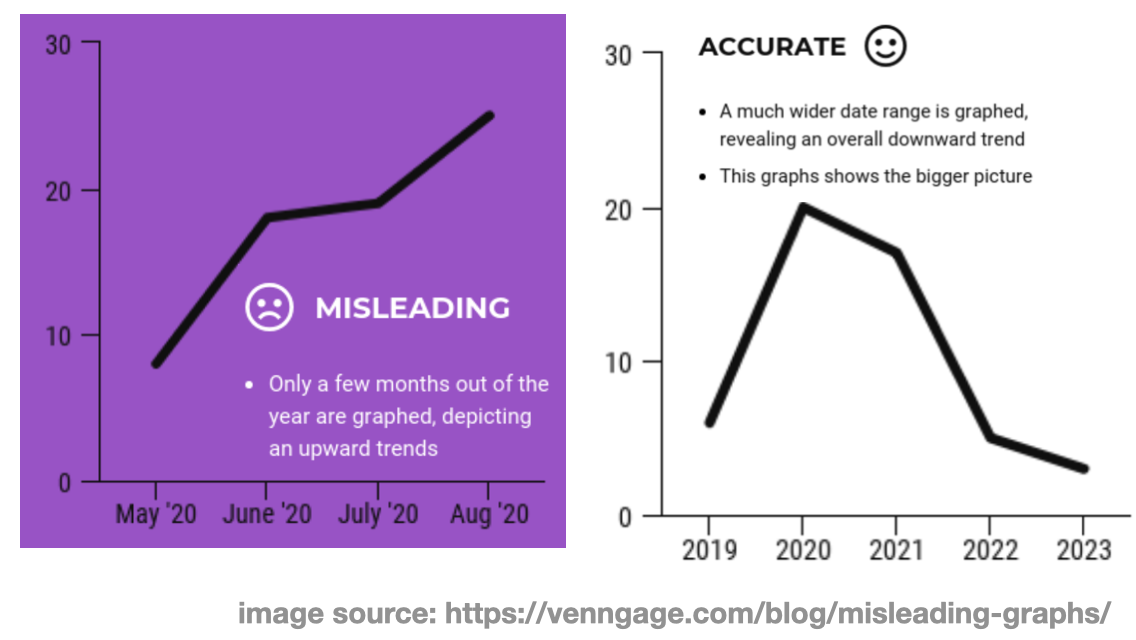
Manipulating the x-axis
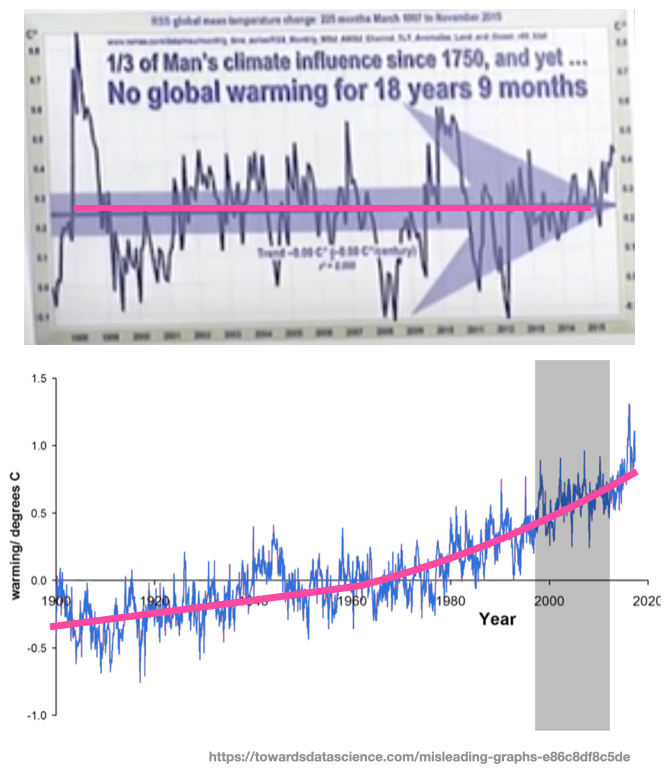
- This is referred to as “cherry-picking”, meaning only showing the data that supports your message and excluding the rests.
![]()
- Don’t do this, instead be honest, and let the data speak for itself
Cherry picking example
- The top graph is from a congressional hearing on climate change.
- The choice of “18 years and 9 months” is a suspicious choice of plotting window.
![]()
Scale
- The concept of scale is very important in positional encoding
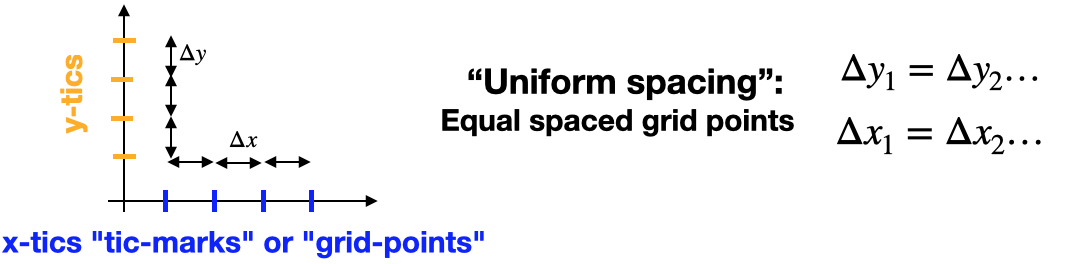
- Linear scale: Equal variations in data result in equal differences in positional encoding
![]()
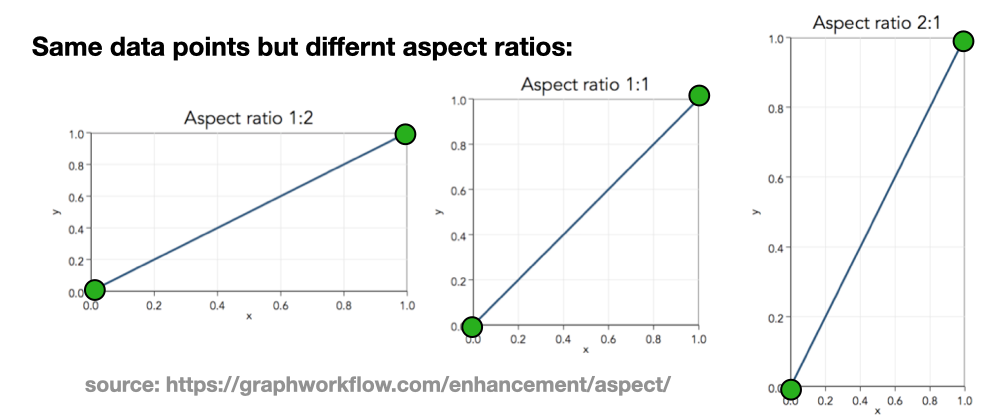
- Aspect ratio: How you stretch the coordinate axis along the x and y dimensions
![]()
Logarithms
- Logarithms are an important mathematical function in data science
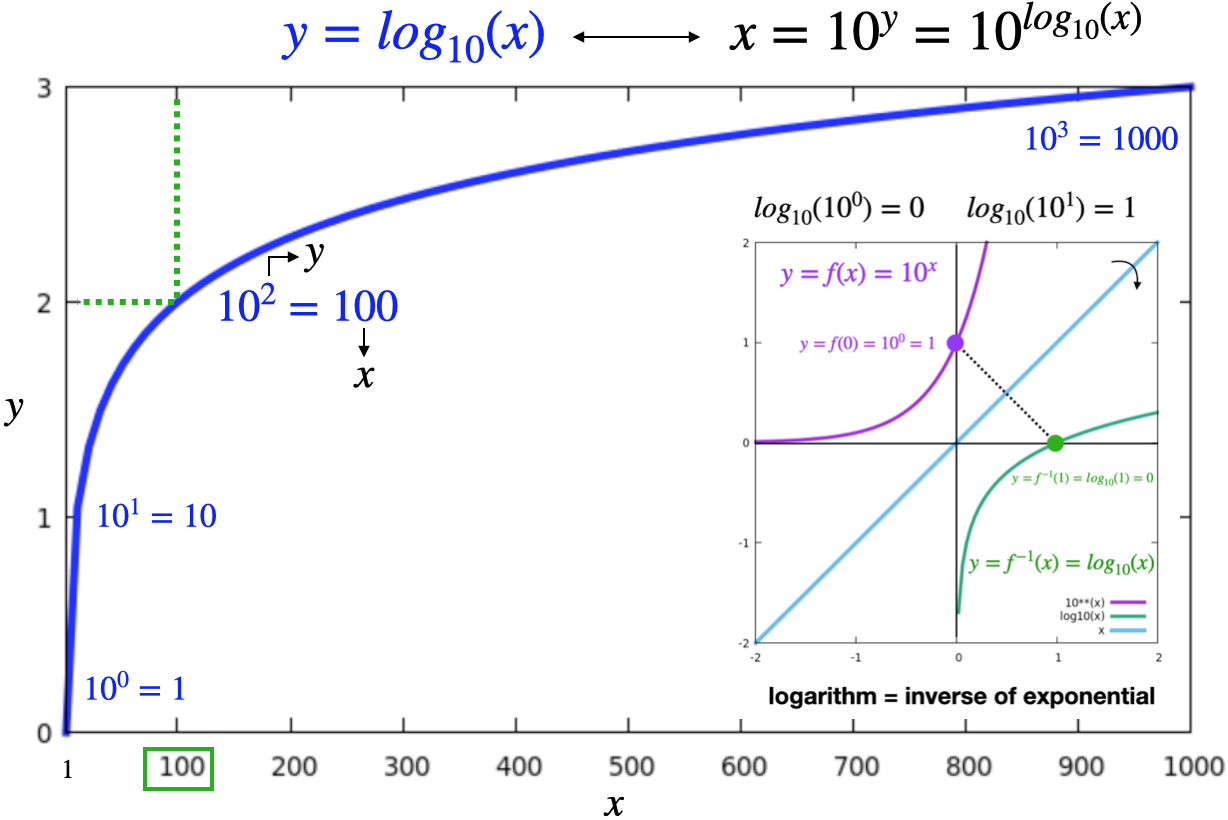
- They represent the inverse of exponentiation
- They also have a normalizing effect by making larger numbers small \(log_{10}(10000)=4\)
![]()
Log-scale
- This is a highly non-linear alternative to the linear scale.
- It is a compact way of displaying numerical data over a very wide range of values
- Equal variations in data result in NON-EQUAL differences in the length encoding
- The numbers 10, 100, 1000, and 10000 are equally spaced on a log-10 scale
![]()
- The numbers 10, 100, 1000, and 10000 are equally spaced on a log-10 scale
- Typically the largest numbers in the data are hundreds or even thousands of times larger than the smallest numbers
- It is helpful to provide intermediate tic-marks to make the graph more intuitive
![]()
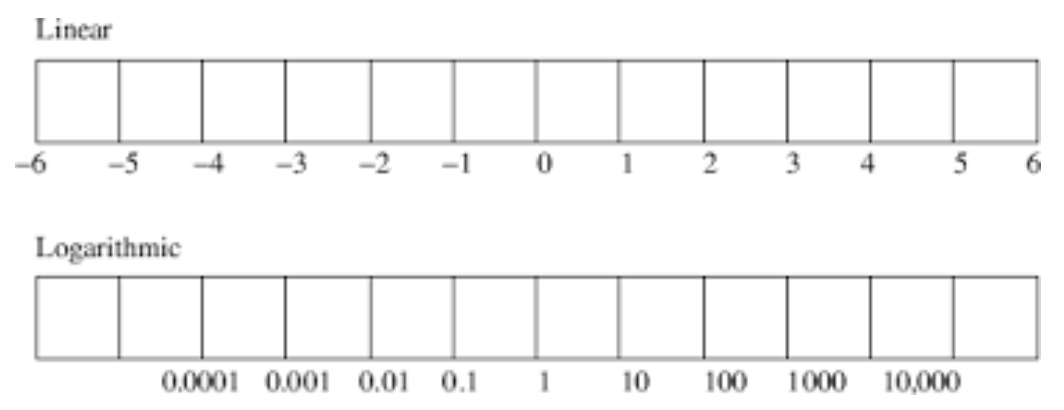

Example-1
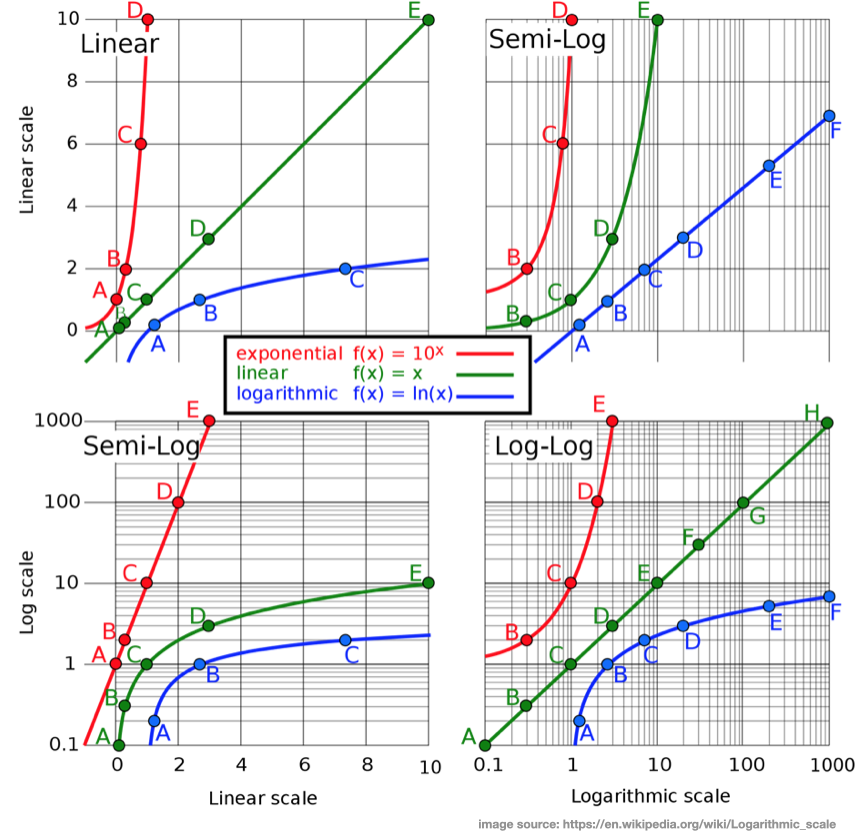
Example-2
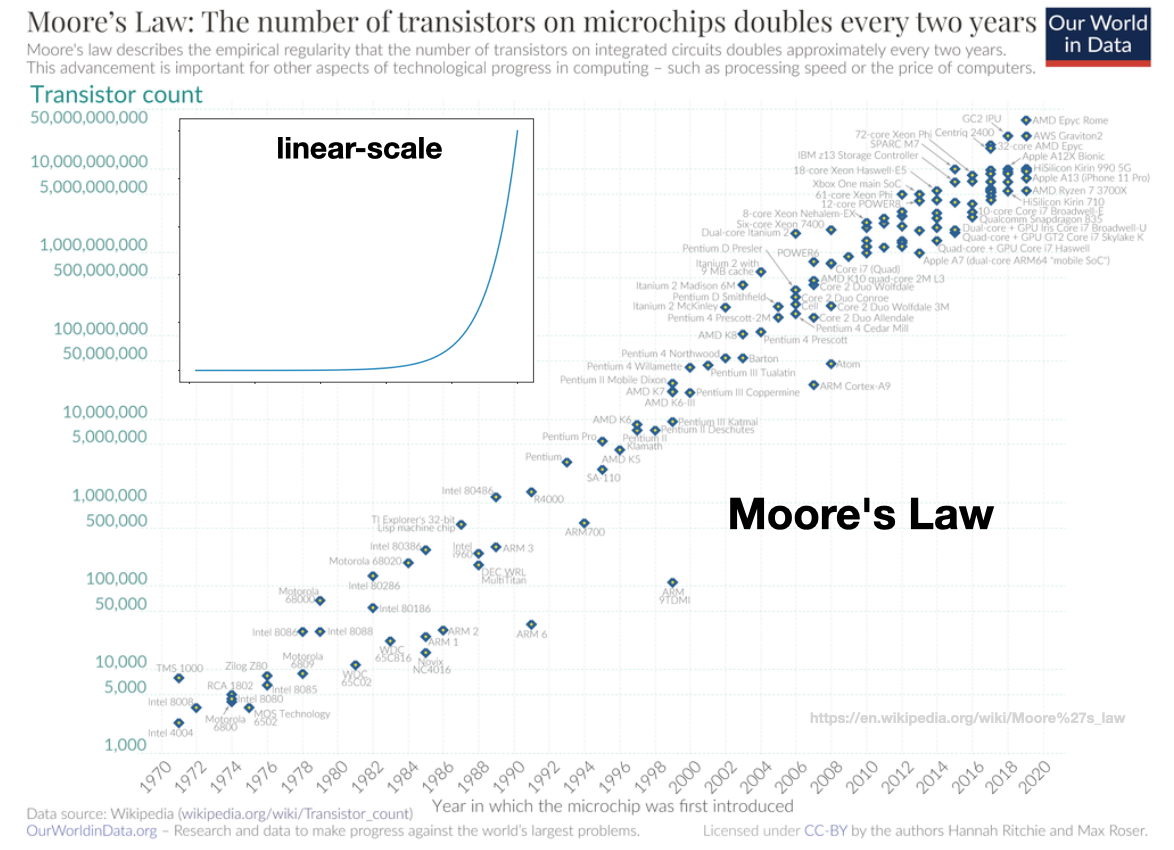
Example-3
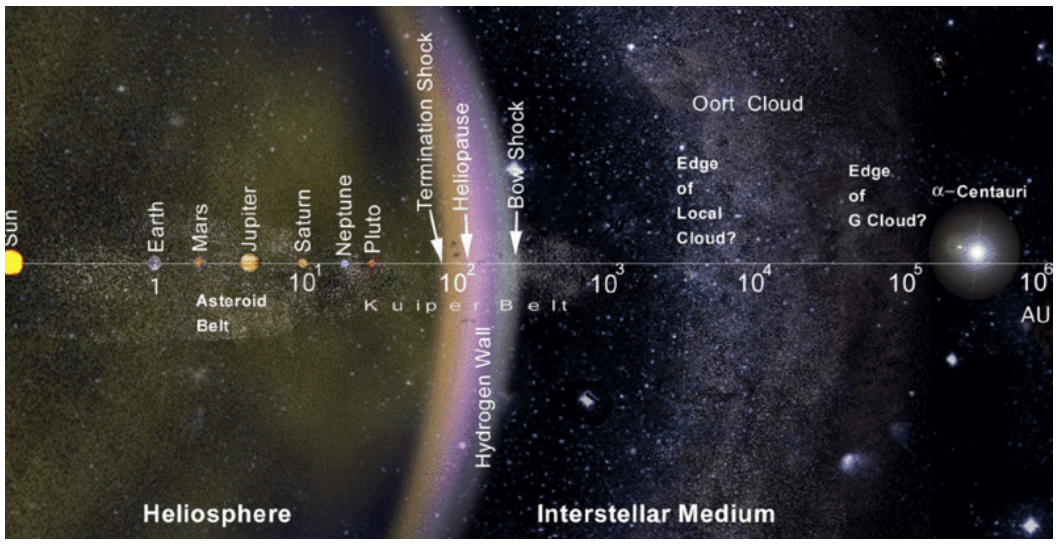
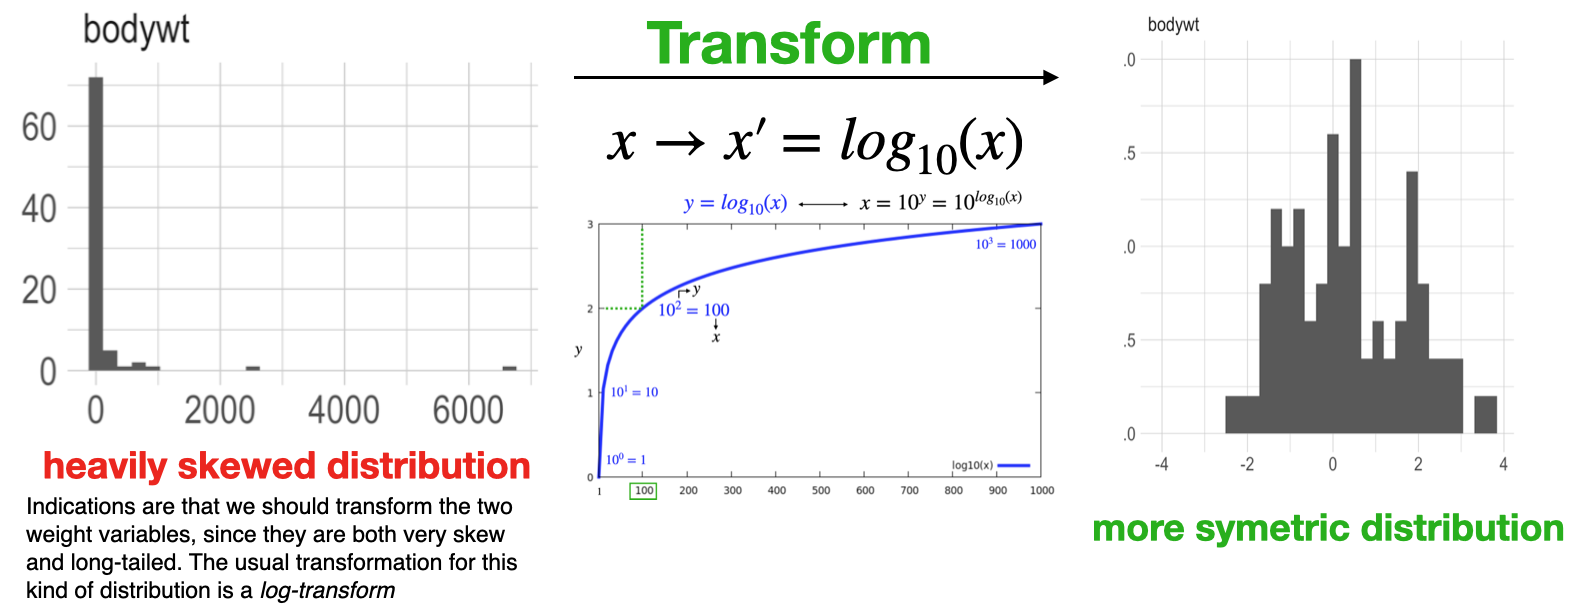
log-transform
- Logarithms are also useful for “un-skewing” distributions.
![]()
Overview
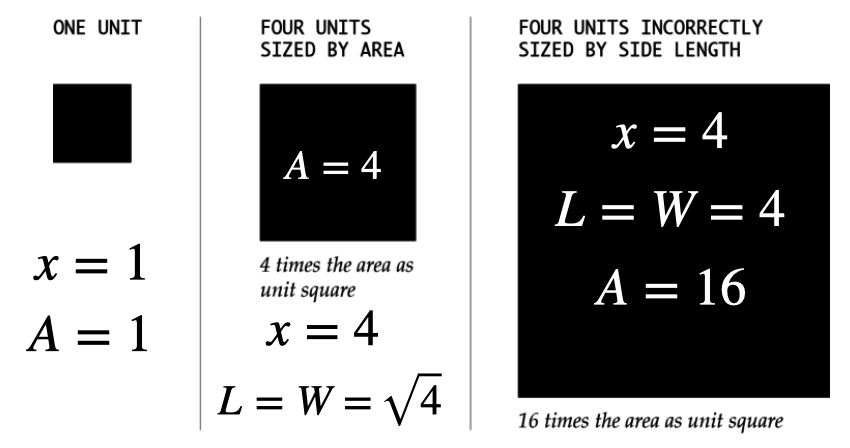
- Like length, area can be used to represent data with size
- While the encoding might not be as precise from a visual perception perspective, area can provide a more intuitive, less abstract view for some types of data
- Make sure you scale your encoding by area, not edge length, which can be misleading
- Correctly encoding a variable \(x\) by area
![]()
Improper scaling
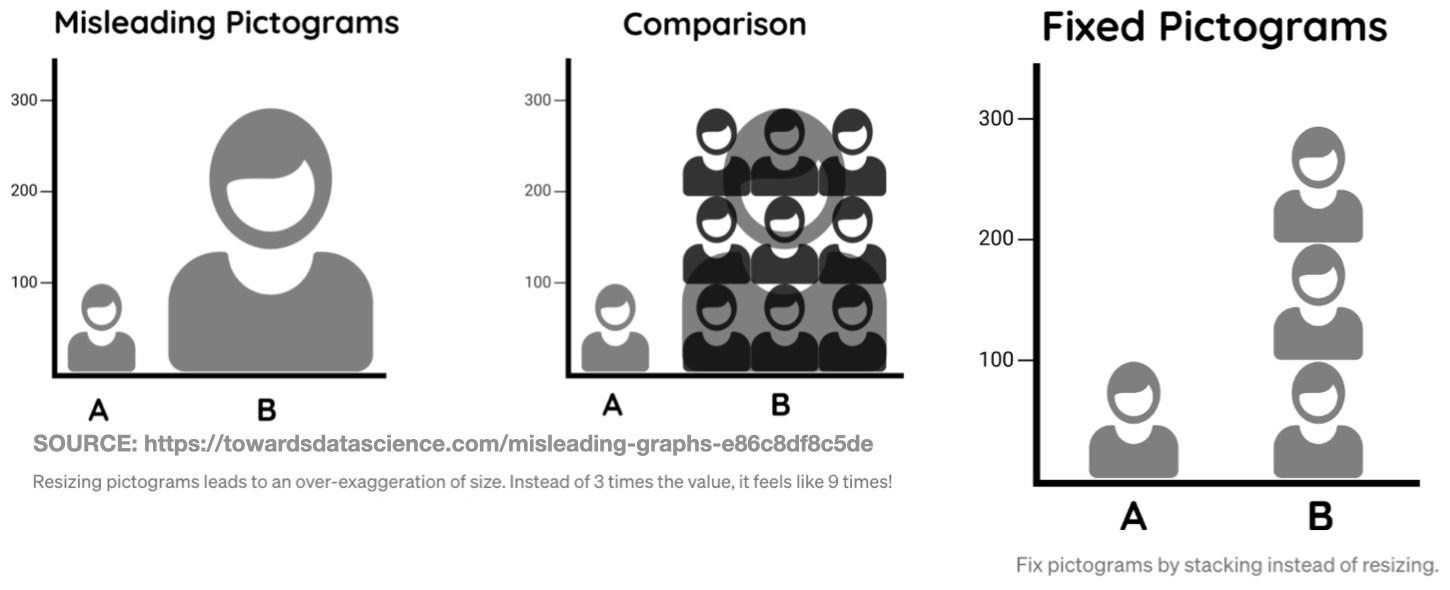
- Note: Again make sure your encoding (area) is proportion to the variable
- Intentionally improperly scaling your encoding is a form of intellectual dishonesty \(\,\)
![]()
Volume encoding
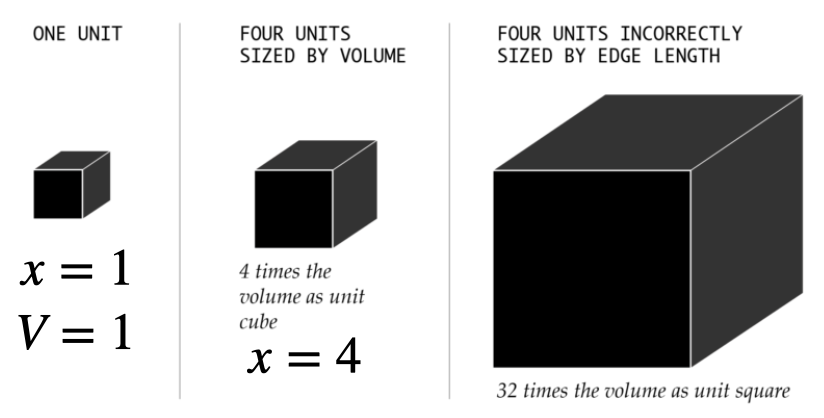
- Used in a similar way as area but has and added dimension.
- The volume, or 3D perspective representation can make data more relatable
- Make sure you scale by volume the not edge (x) (volume gets cubed per unit increase).
![]()
- When encoding a variable x, use \(x^{1/3}\) as the edge to correctly encode variable as volume
![]()
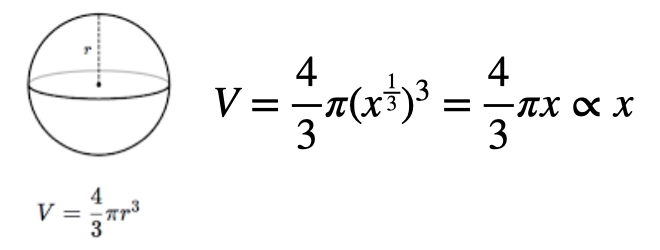
Angular encoding
- Angles range from 0 to 360 degrees in a circle.
- Units: \(\text{ 1 oscillation }=\text{1 revolution }=360^o \,(degrees)=2\pi \text{ radians}\)
- Angles are most associated with pie charts
![]()
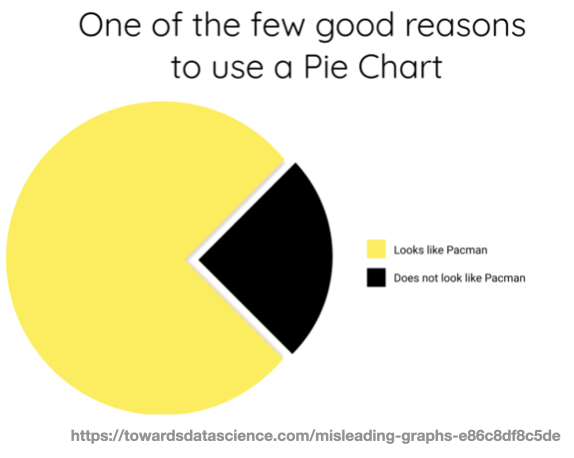
Pie charts
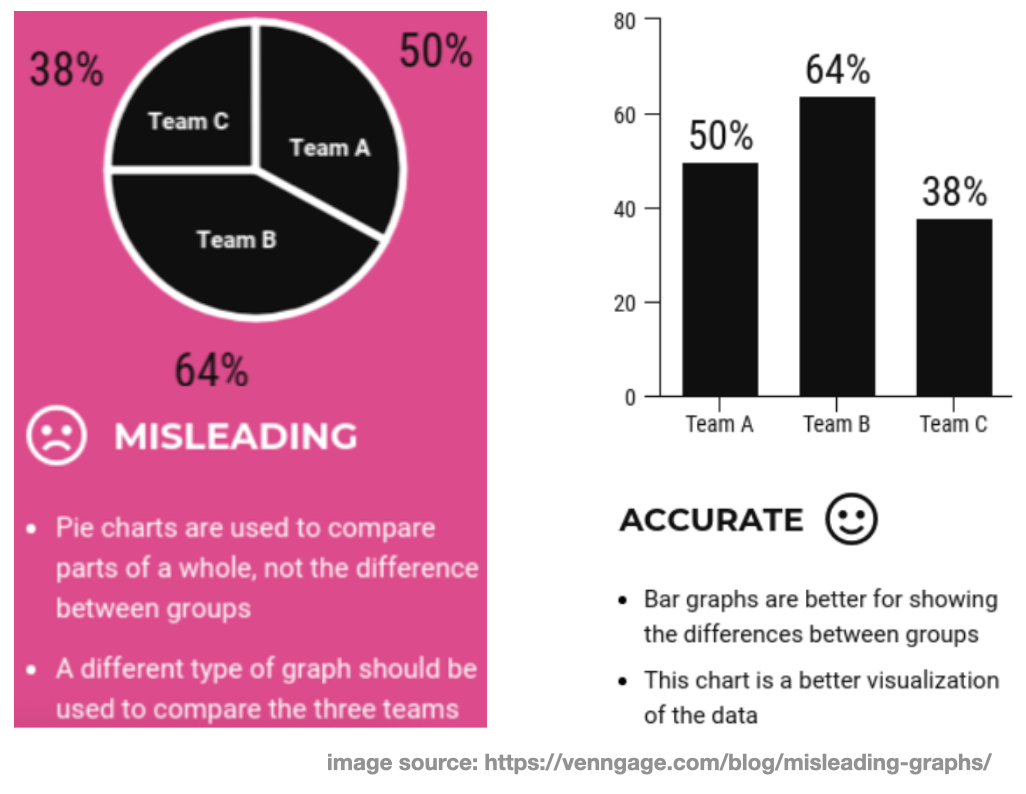
- People commonly mis-use (or over-use) pie charts. If you decide to use one, remember
- Pie charts describe percentages of a whole, the sum should equal 100%!
![]()
- Pie charts describe percentages of a whole, the sum should equal 100%!
- Don’t use too many categories (bar chart is a better option in this case).
![]()
- Don’t use too many categories (bar chart is a better option in this case).
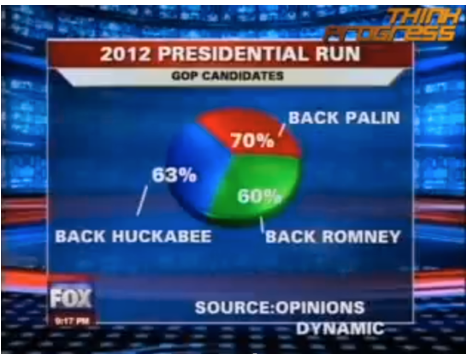
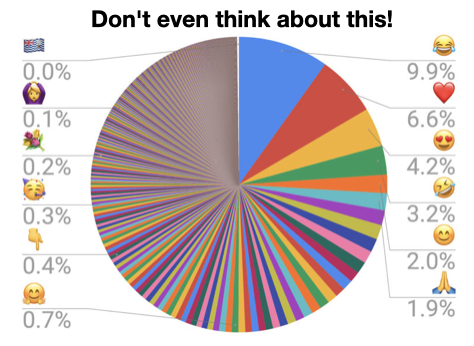
Using the wrong graph:
- Note: Always make sure to use an appropriate encoding for your data.
![]()
Slope encoding
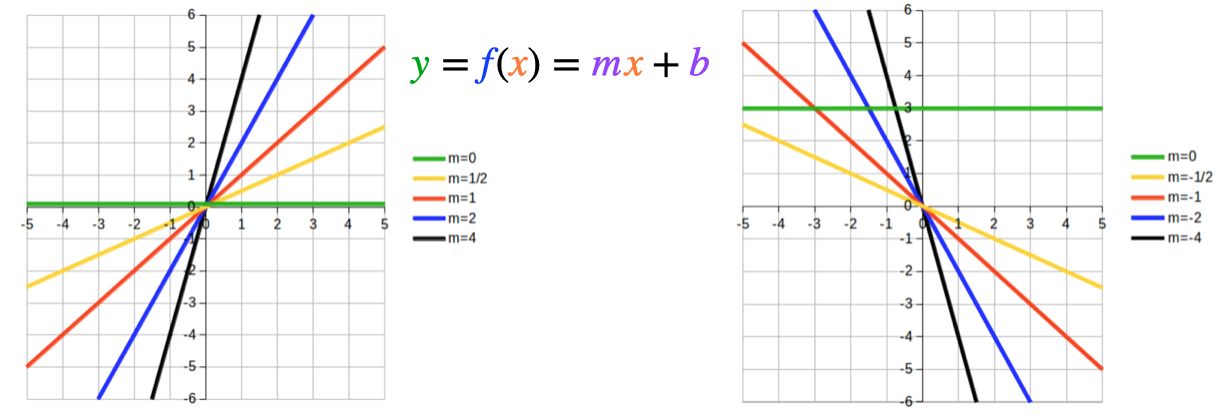
- Slope is similar to angle, and most commonly used in line charts
- Slope magnitude: steeper = greater change, flatter = lesser change.
![]()
- Beware of aspect ratio: The visual change should match the actual change
![]()
Complimentary colors
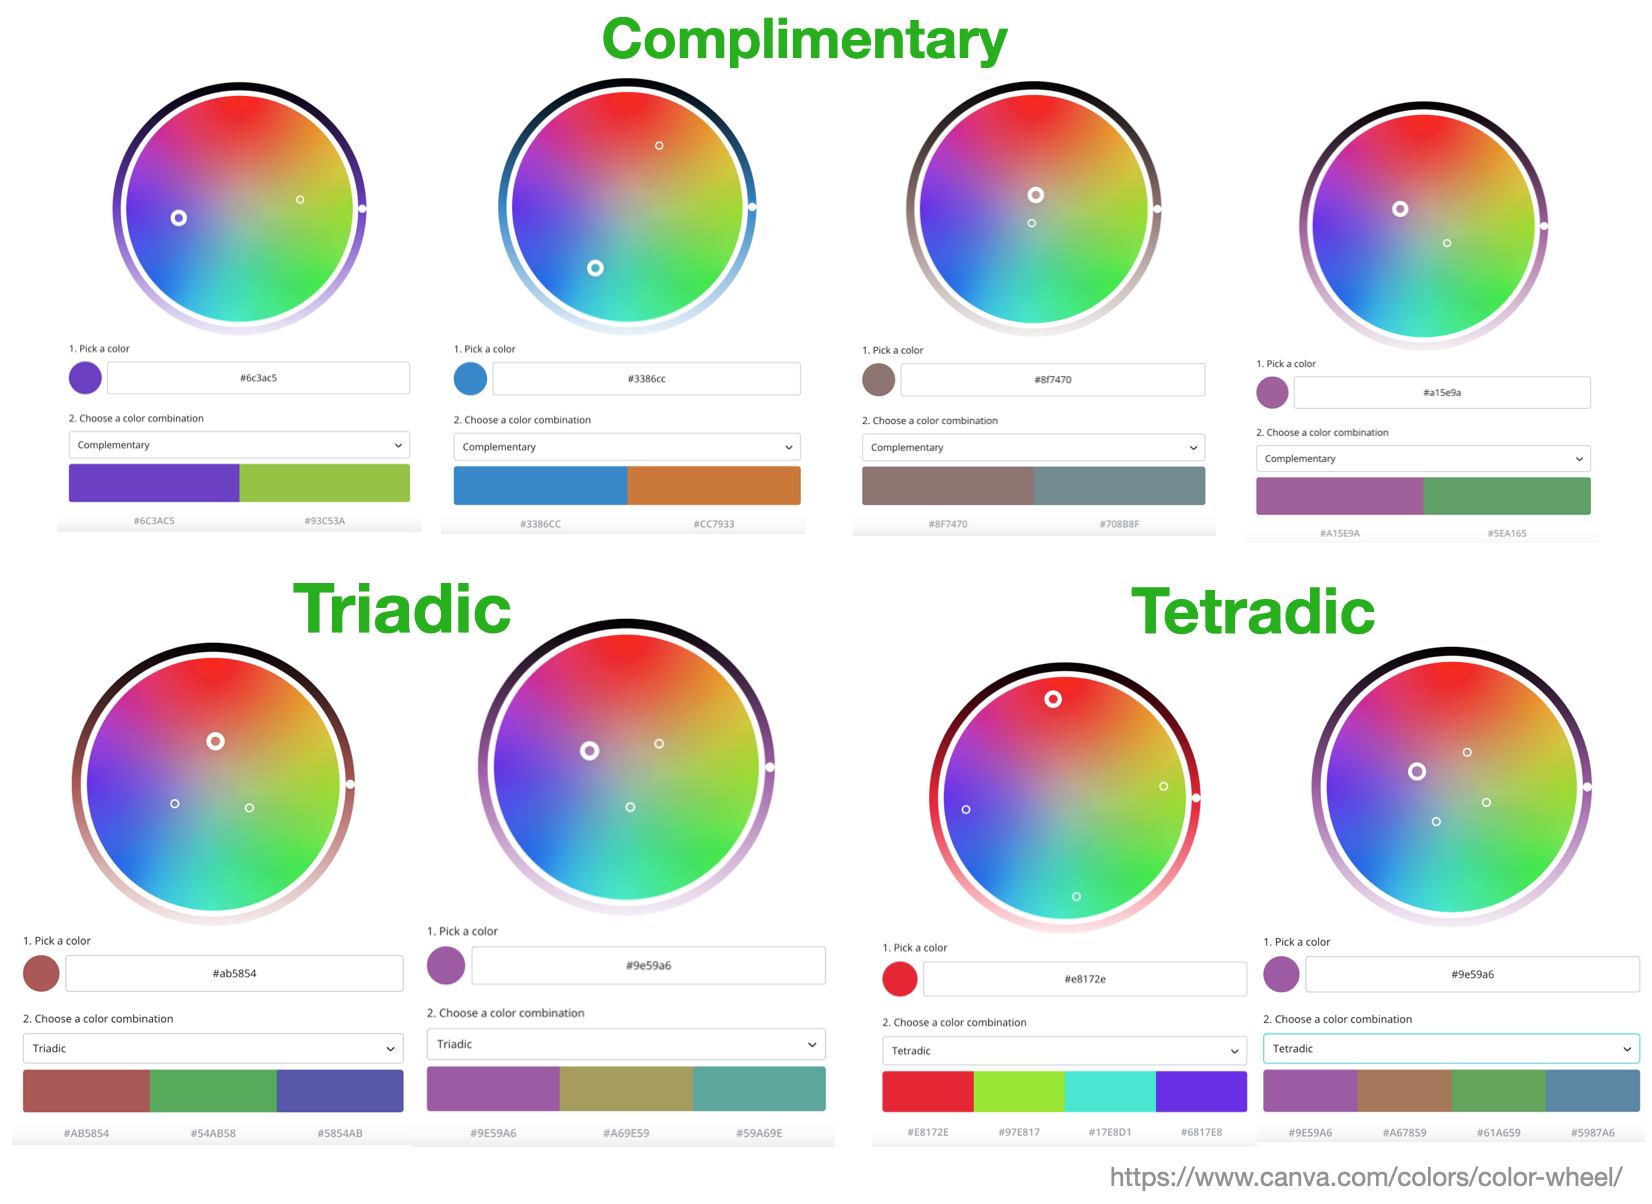
- Certain sets of colors tend to “look good” together based on their relative geometric positioning on the color wheel
- These pairings form the basis for defining various color palettes
![]()
Color palettes
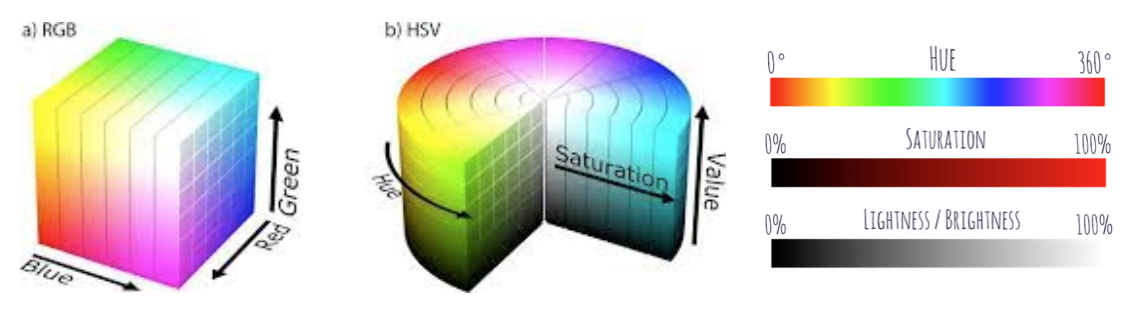
- Color as a visual encoding can be split into two categories: hue and saturation.
![]()
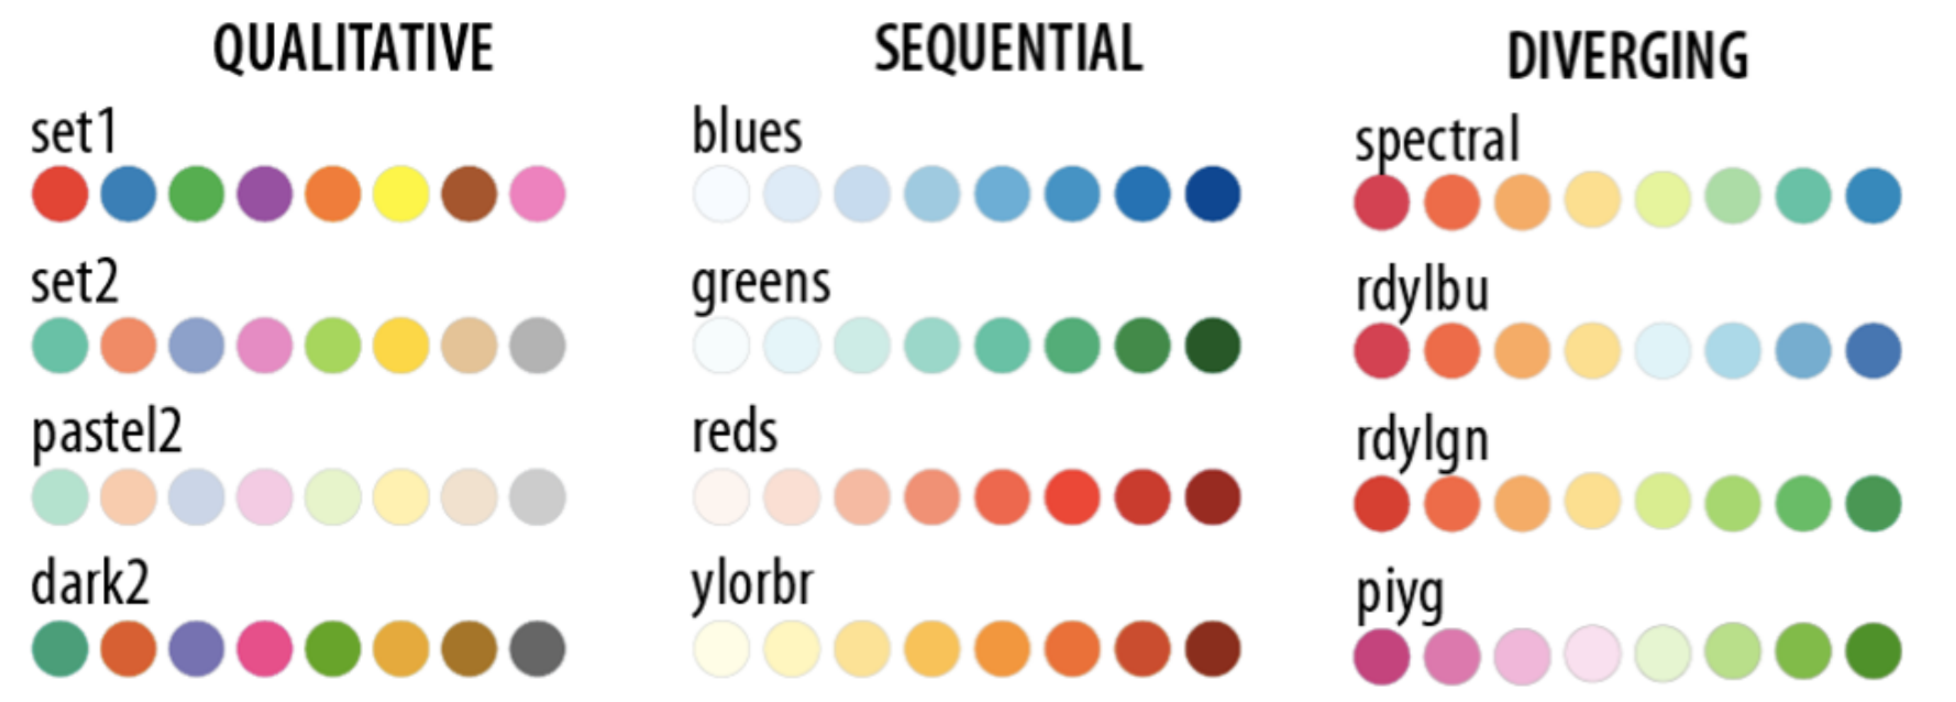
- Qualitative: every color represents a distinct attribute (category)
- Sequential: color represents a range (saturation) from low to high (or vice-versa)
- Diverging: multiple hues represent a point of inflection of the data
![]()
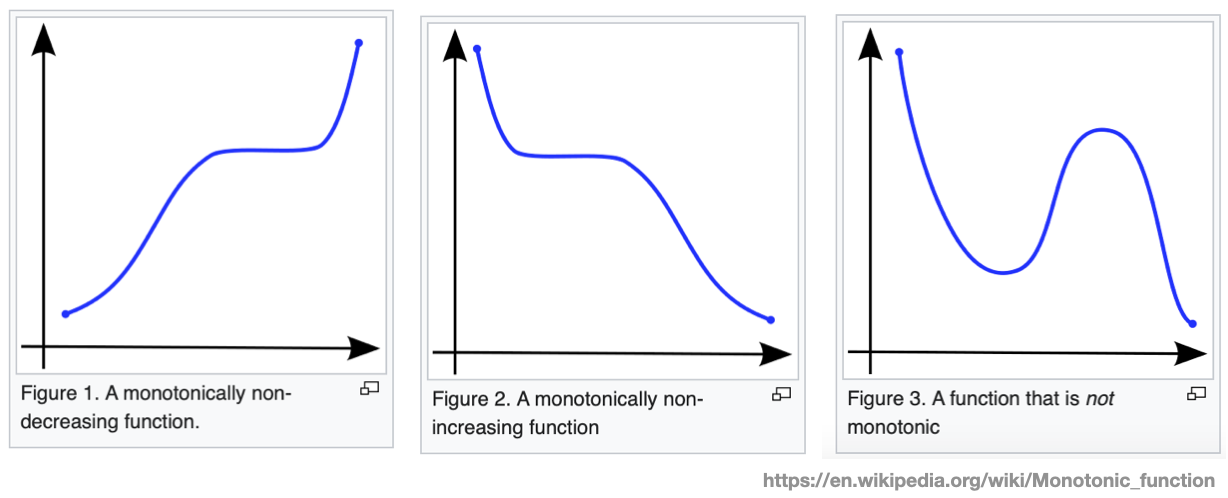
Monotonicity
- In mathematics, a monotonic function (or monotone function) is a function between ordered sets that preserves or reverses the given order
- The monotonicity in the variation of the data often dictates which color palette to use
![]()
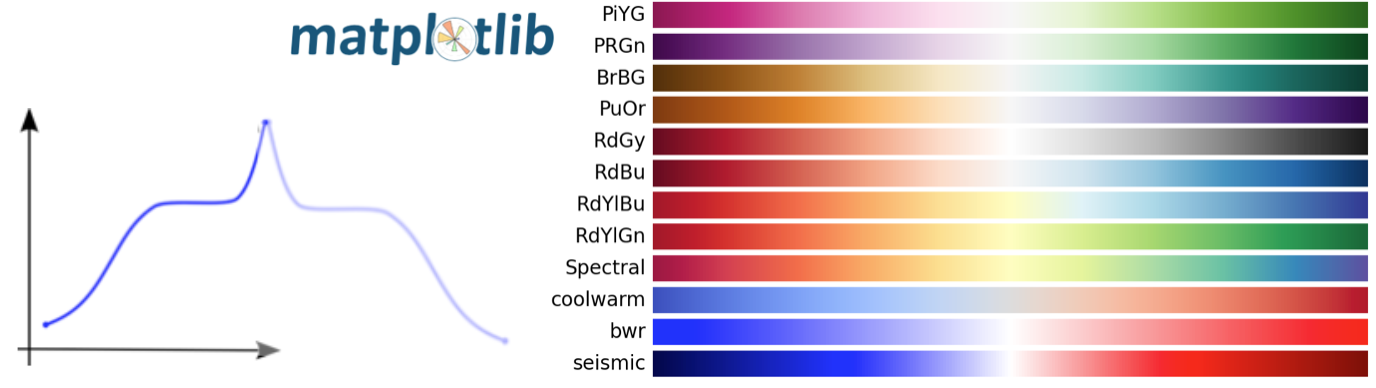
Diverging color maps
- For the Diverging maps, we want monotonically increasing x up to a maximum, followed by monotonically decreasing values. We are looking for approximately equal minimum values at opposite ends of the colormap 1
![]()
Example
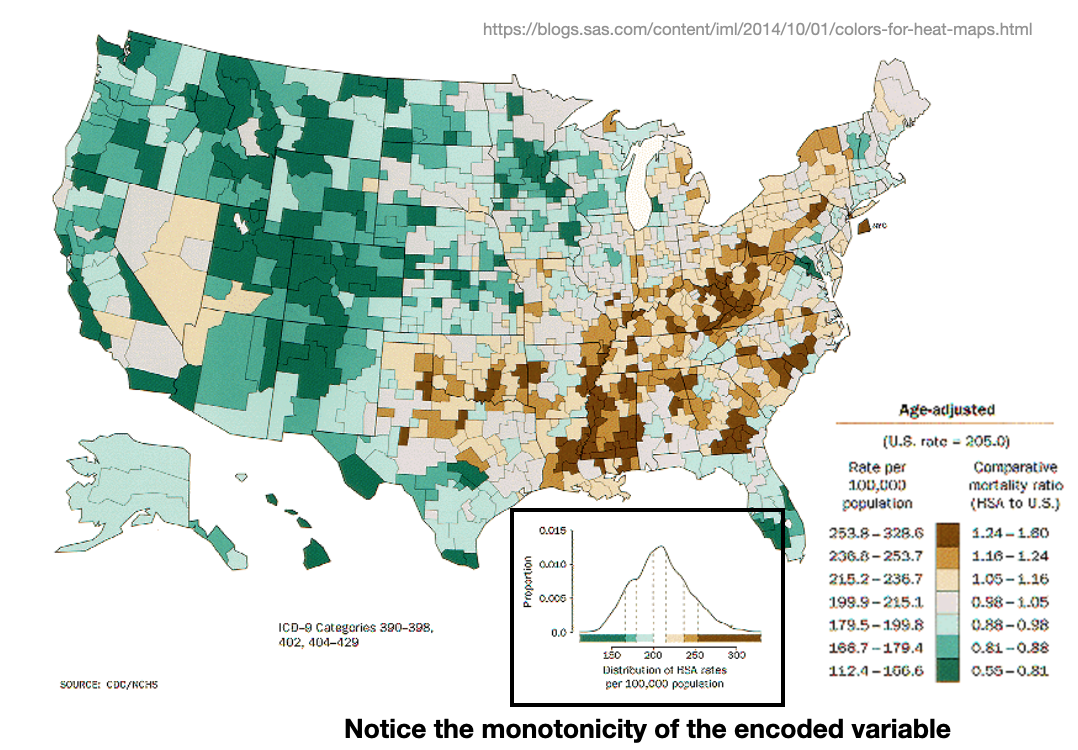
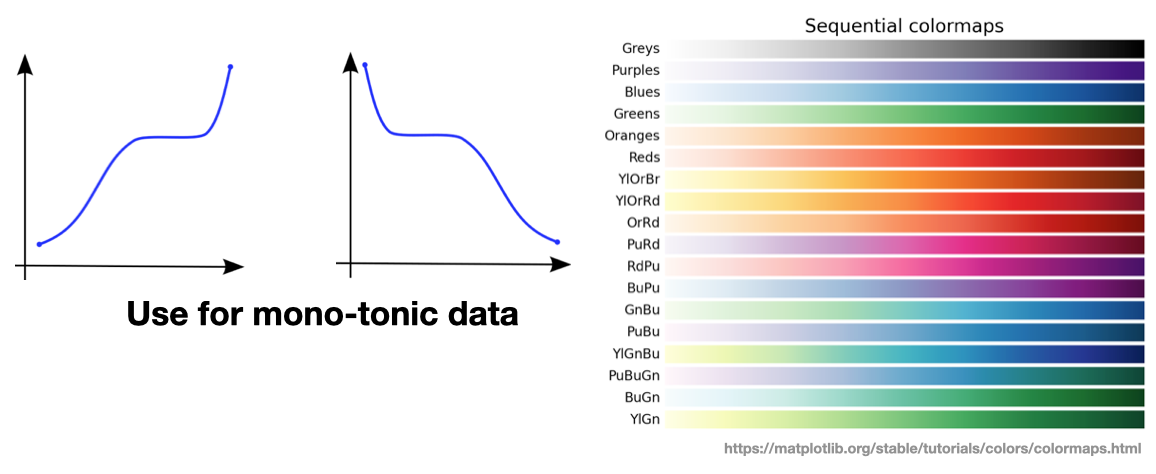
Sequential color maps
- In sequential plots, the lightness increases monotonically through the color-maps.
![]()
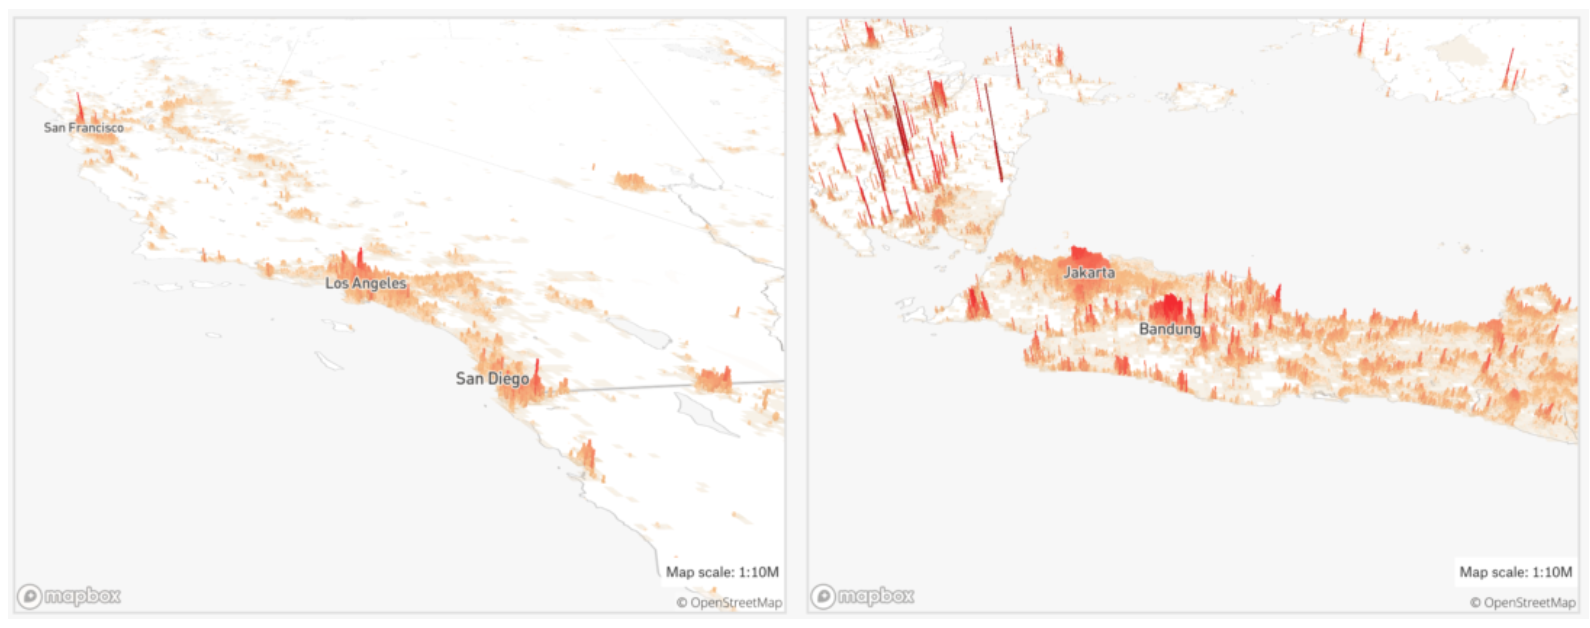
Example
- The following takes advantage of a sequential color map to visualized a monotonic deviation in population density.
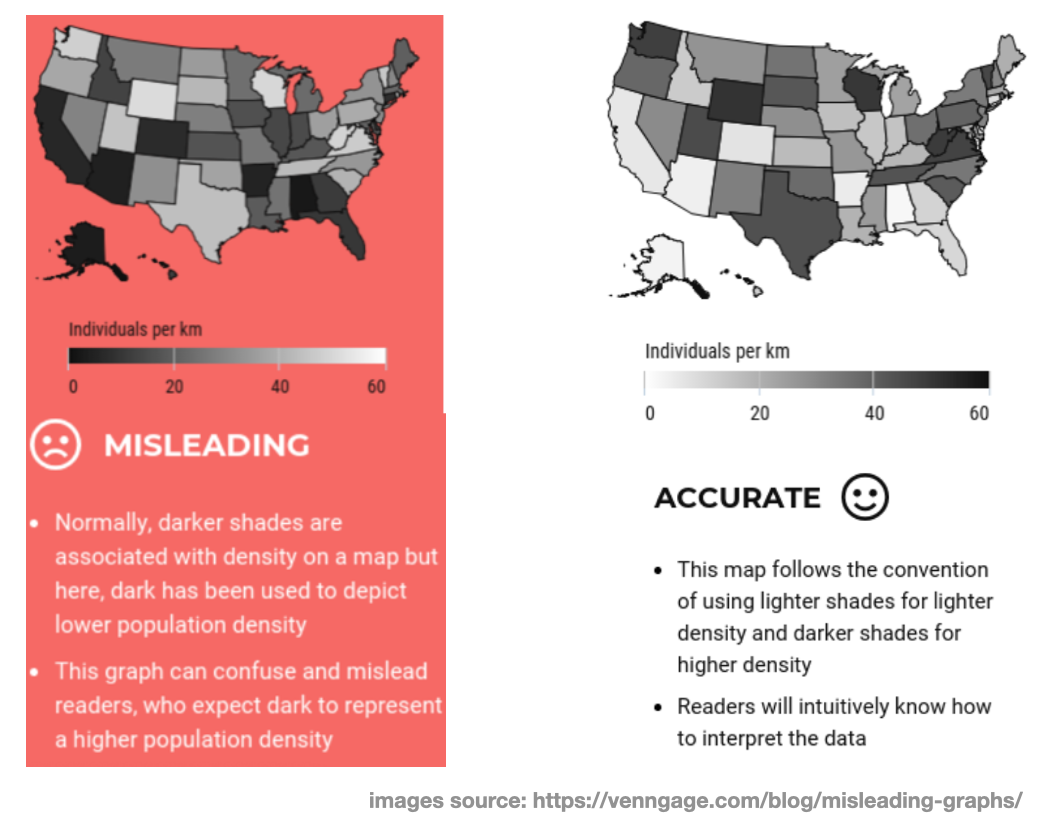
Going against conventions
- Another way to mis-represent data is to “go against conventions”. This can be done by flipping a color scheme from what people would typically expect it to be.
![]()
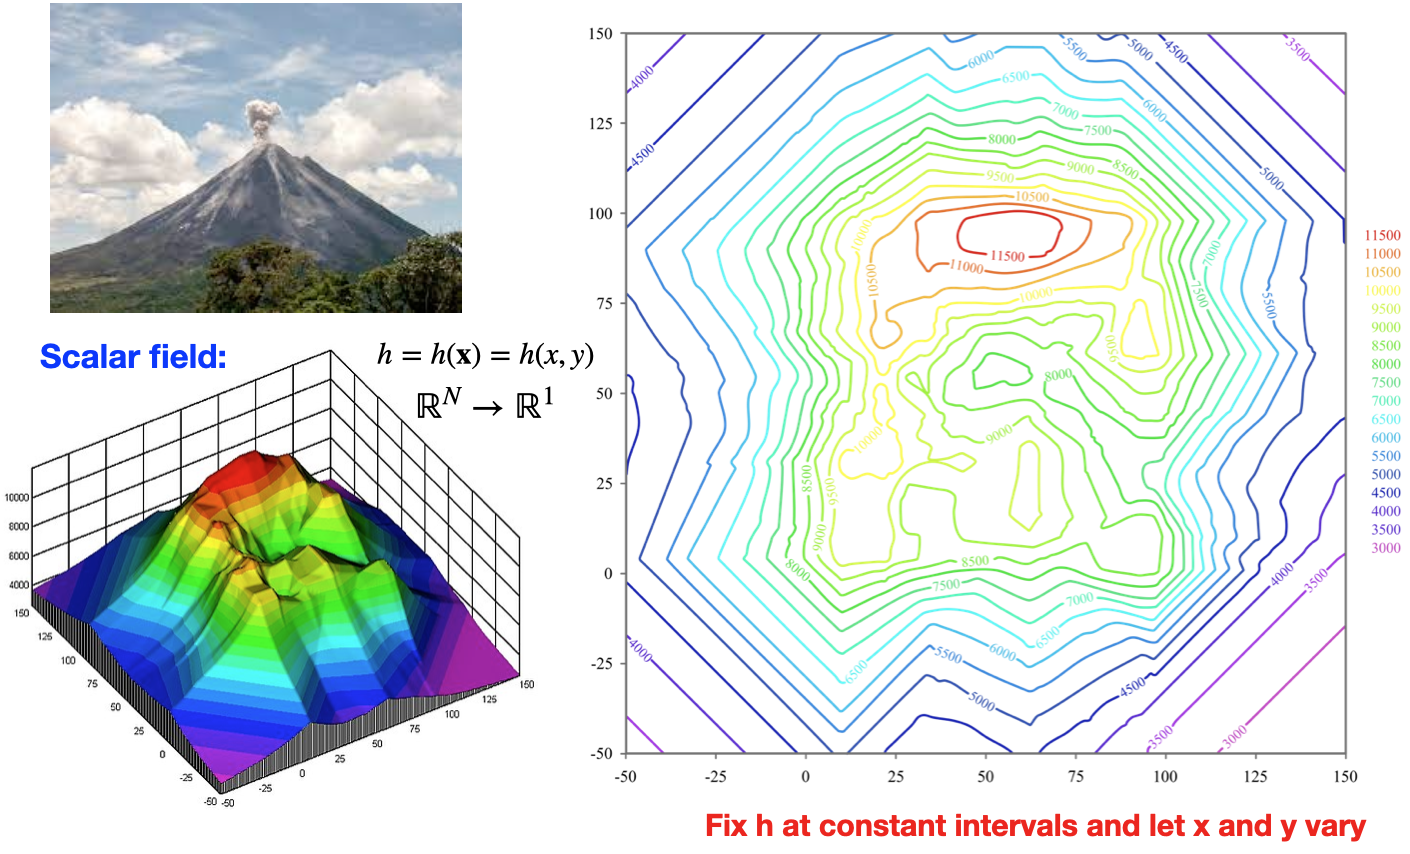
Example: Contour plots
- The following takes advantage of a sequential color map to visualized a monotonic deviation in height.
![]()
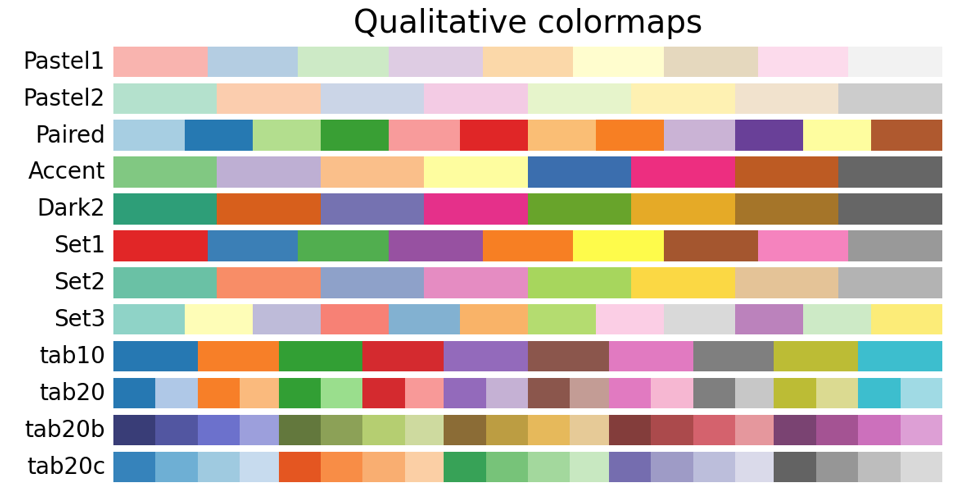
Qualitative color maps
- Qualitative color maps are best used for qualitative data, as the name suggest.
![]()
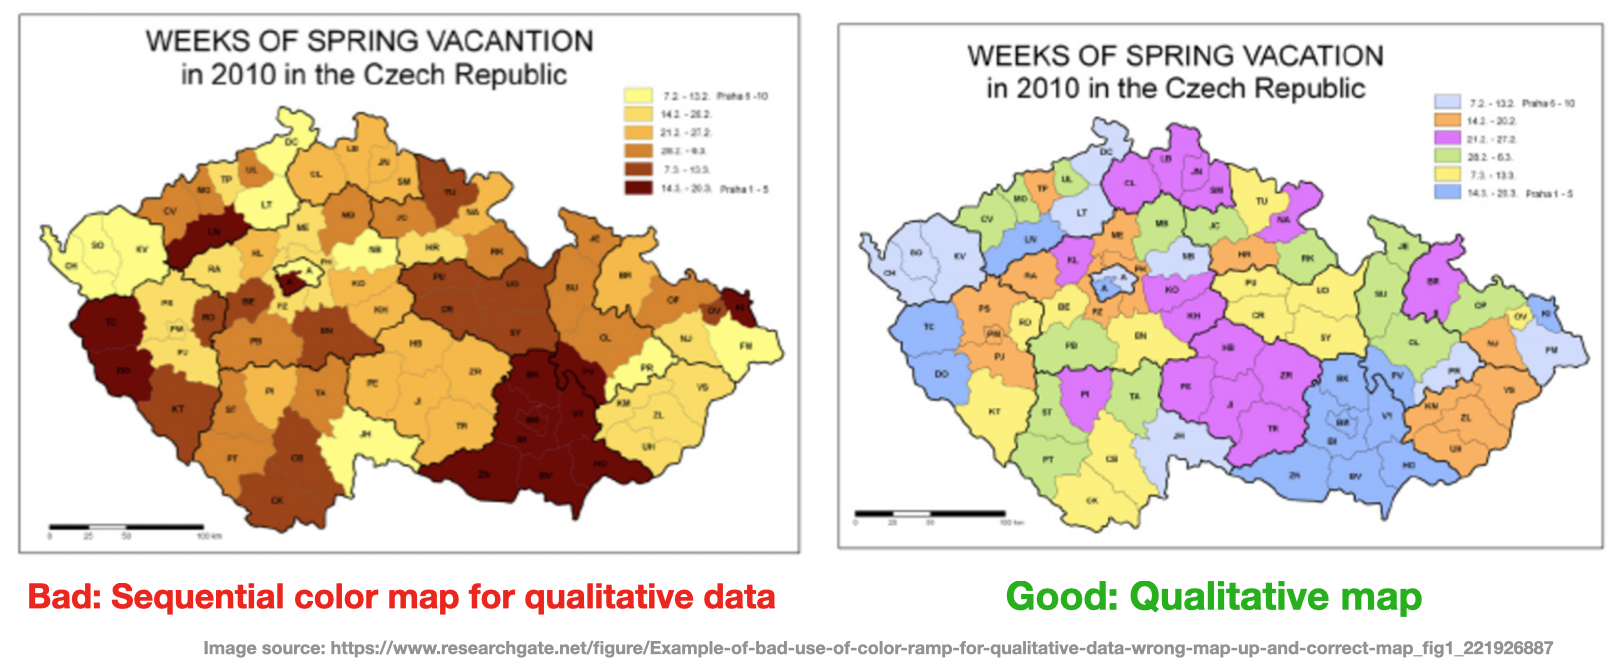
Example
- In the following image we can see good and bad choices for color maps
![]()
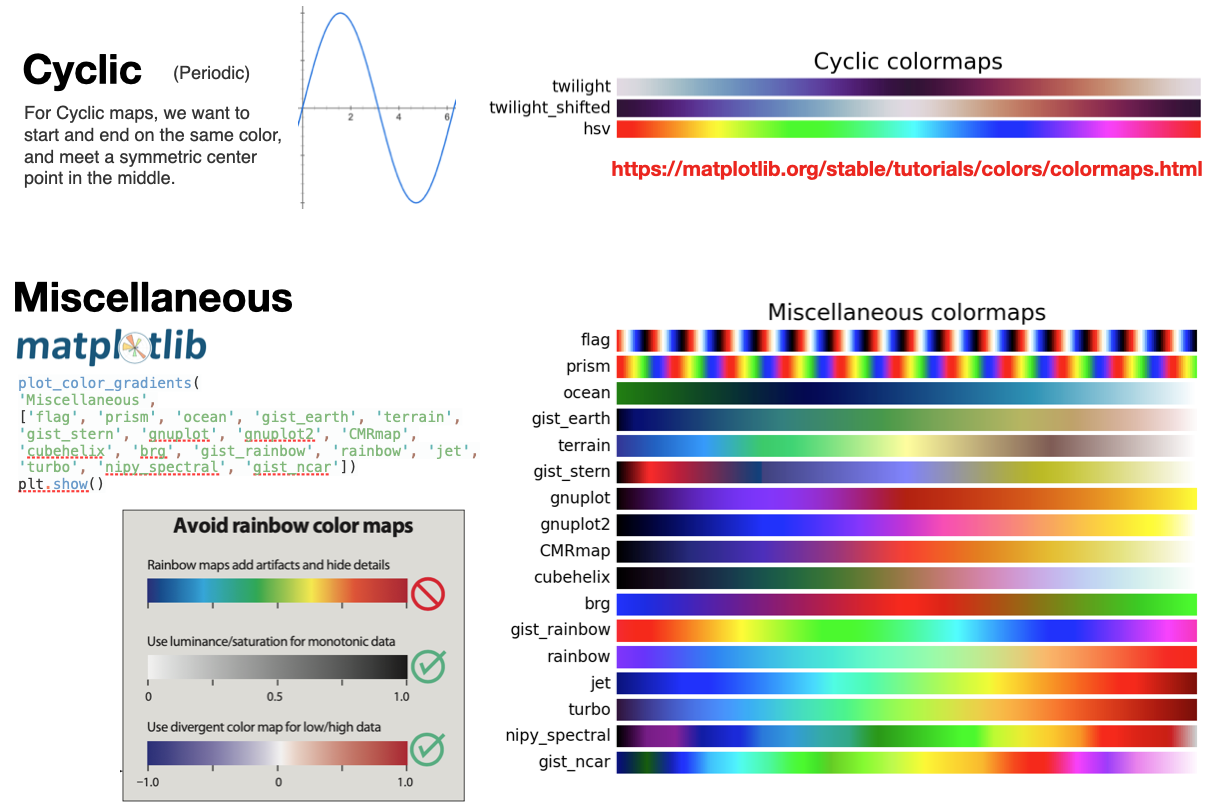
Additional color-maps
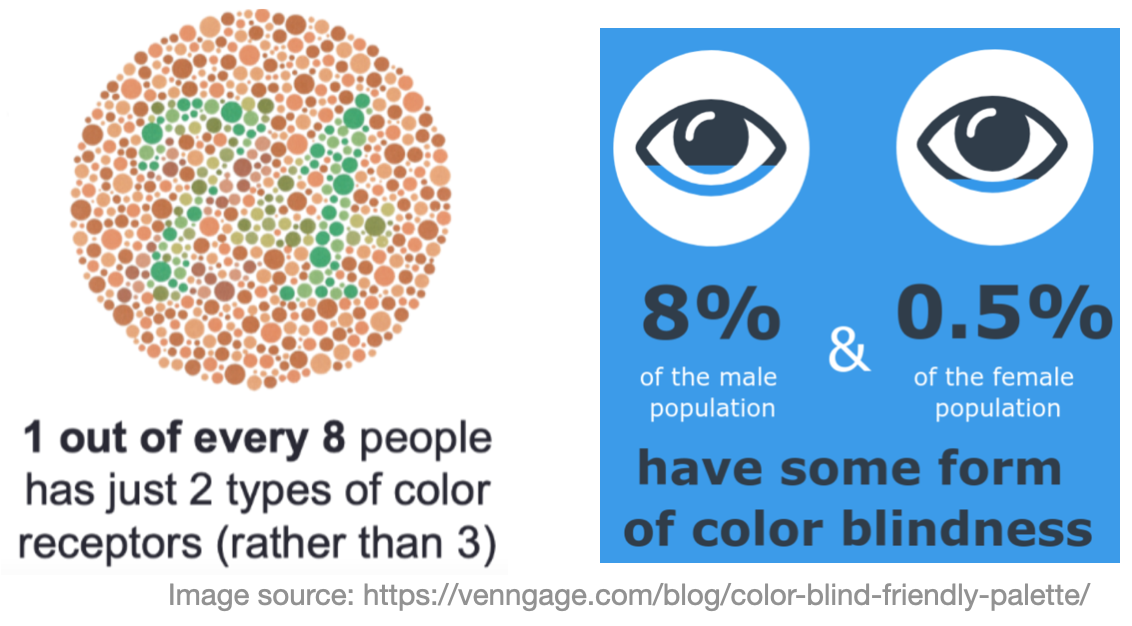
Color blindness
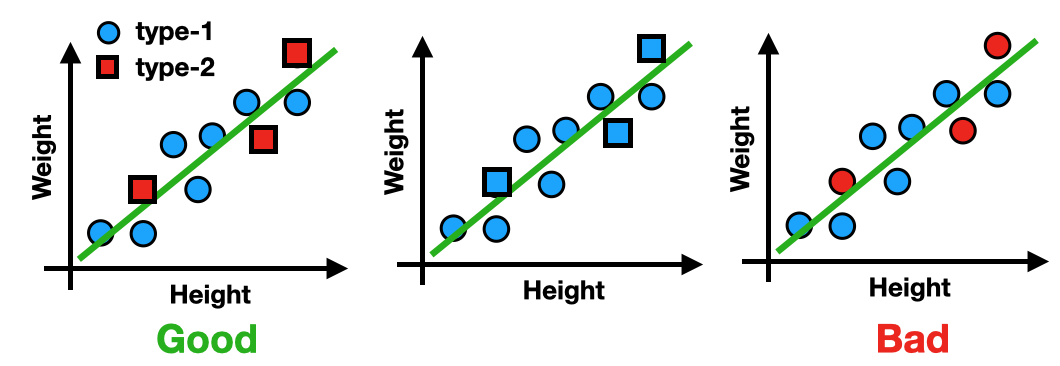
- It is also important to be accommodating to individuals with color blindness
- Red/Green Color Blindness in particular is very prevalent.
![]()
- The easiest way to do this is to use different markers for different categories
![]()
Color blindness
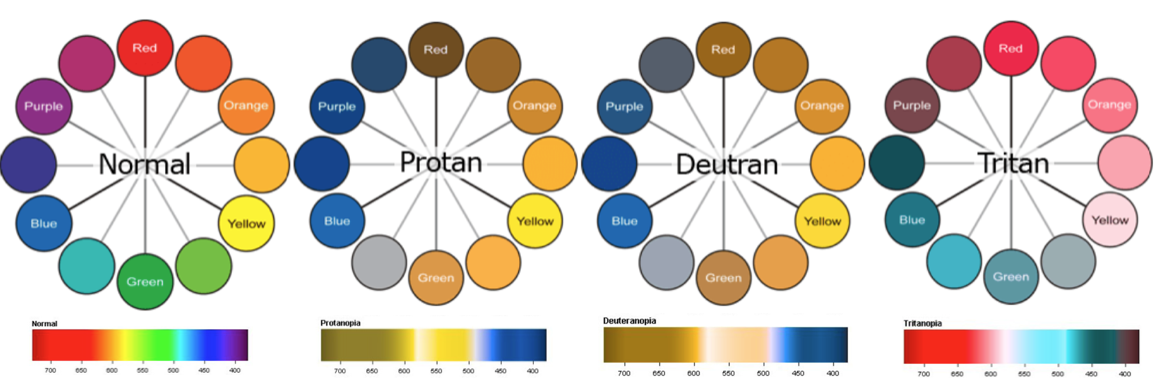
- The following are the three types of color blindness.
![]()
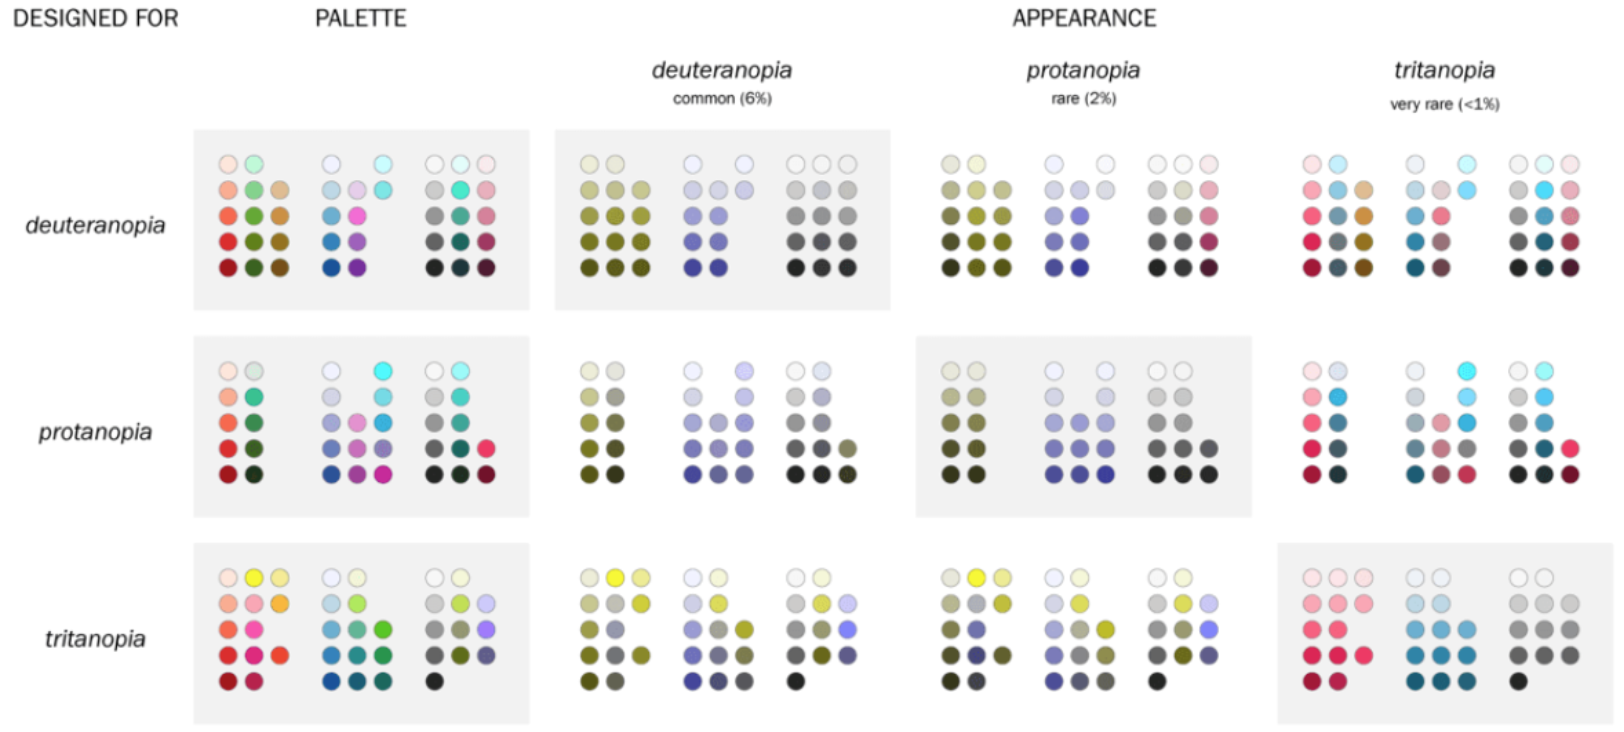
- Some color pallets are specifically adapted to accommodate this
![]()
Visualization is an iterative process
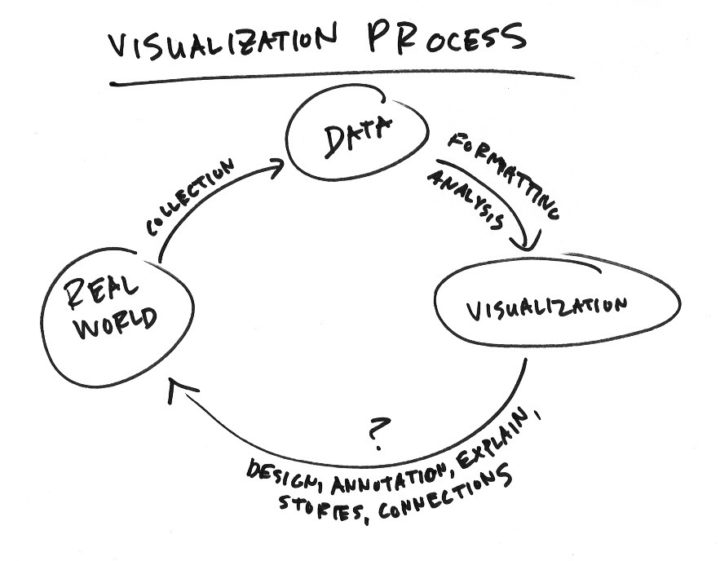
- Don’t expect your visualizations to require just one attempt.
- As you will see throughout the course, the process is very iterative
- e.g. (0) Create (1) modify (2) re-render (3) re-evaluate … repeat until satisfied
![]()
- e.g. (0) Create (1) modify (2) re-render (3) re-evaluate … repeat until satisfied
- LLM tools can be very helpful in this process!
- A lot of data visualization is syntactical, so LLMs can be helpful for generating code.
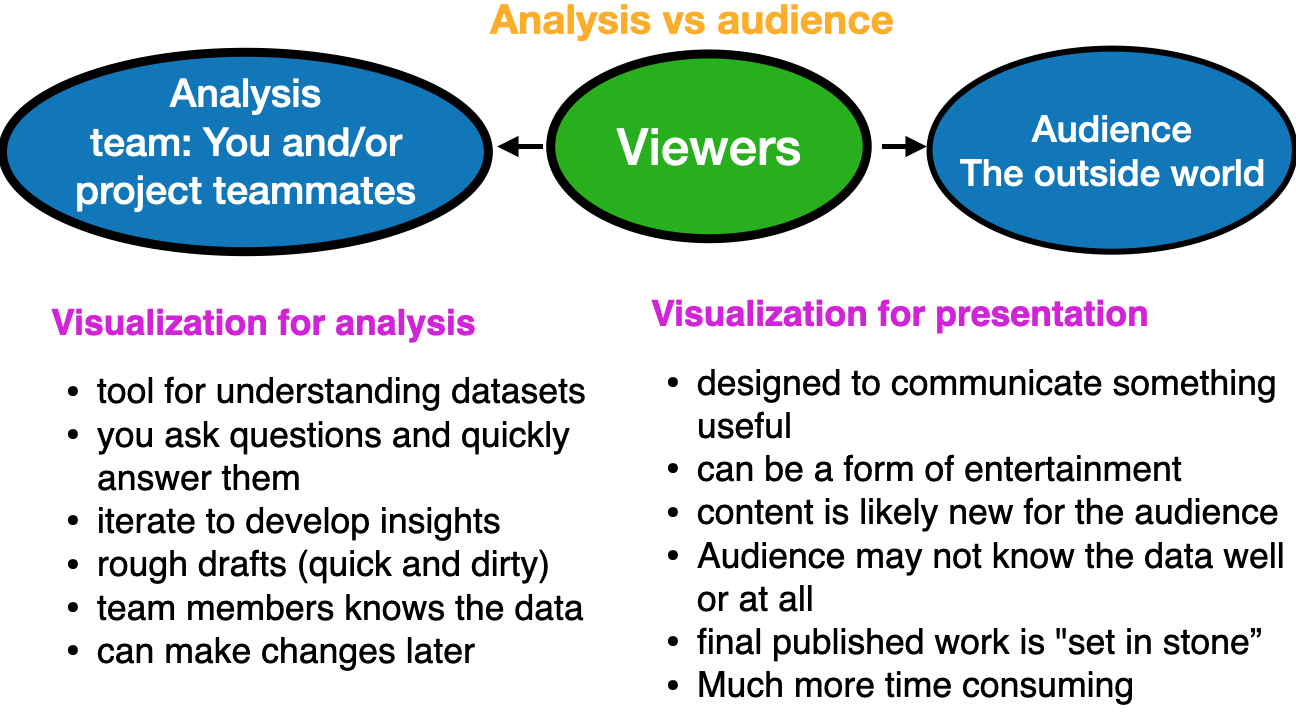
The two audiences
- Important to be able to adjust for differences between visualization for analysis and for an audience
![]()
Put in the effort
Visualization Guidelines
- Choose the right vis: match the chart type to the data and message
- Vary your visuals: use diverse, creative chart types (e.g., at most one or two bar charts)
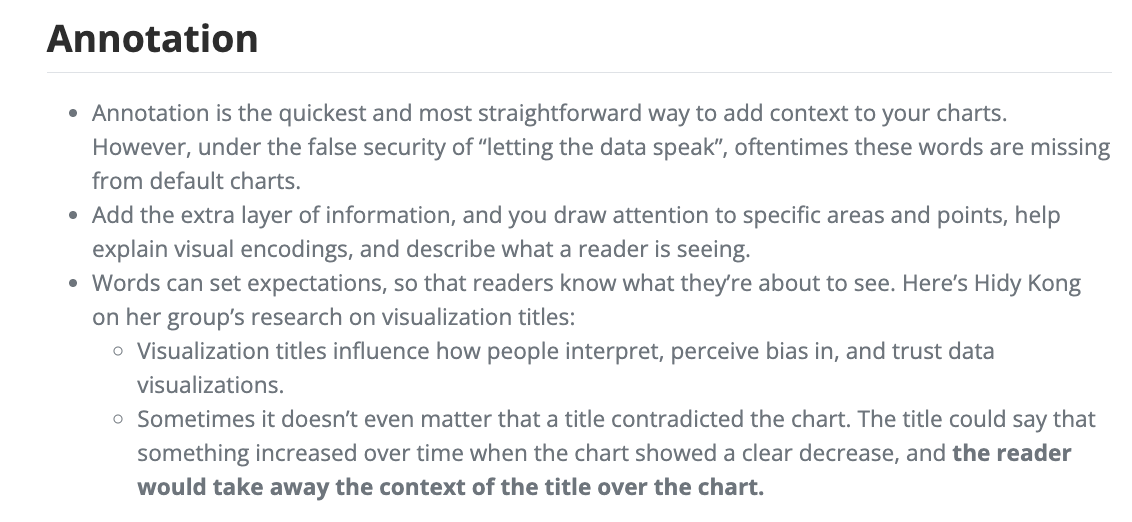
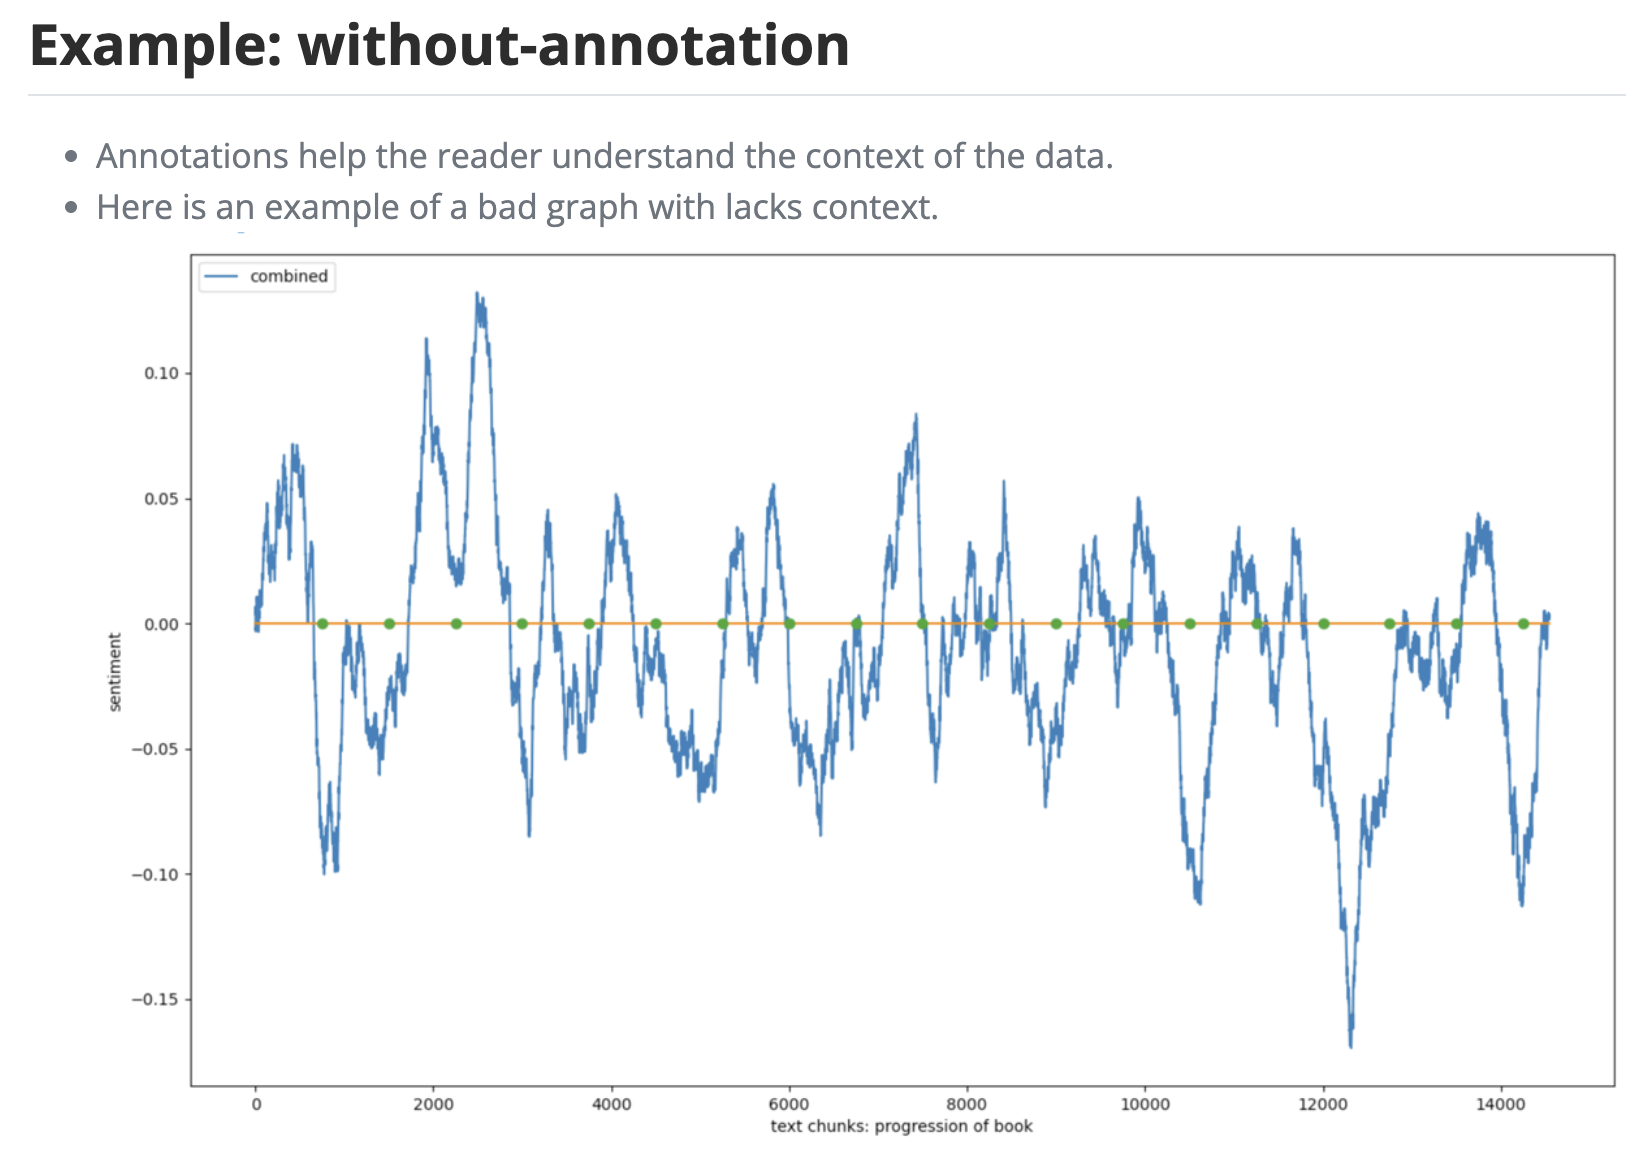
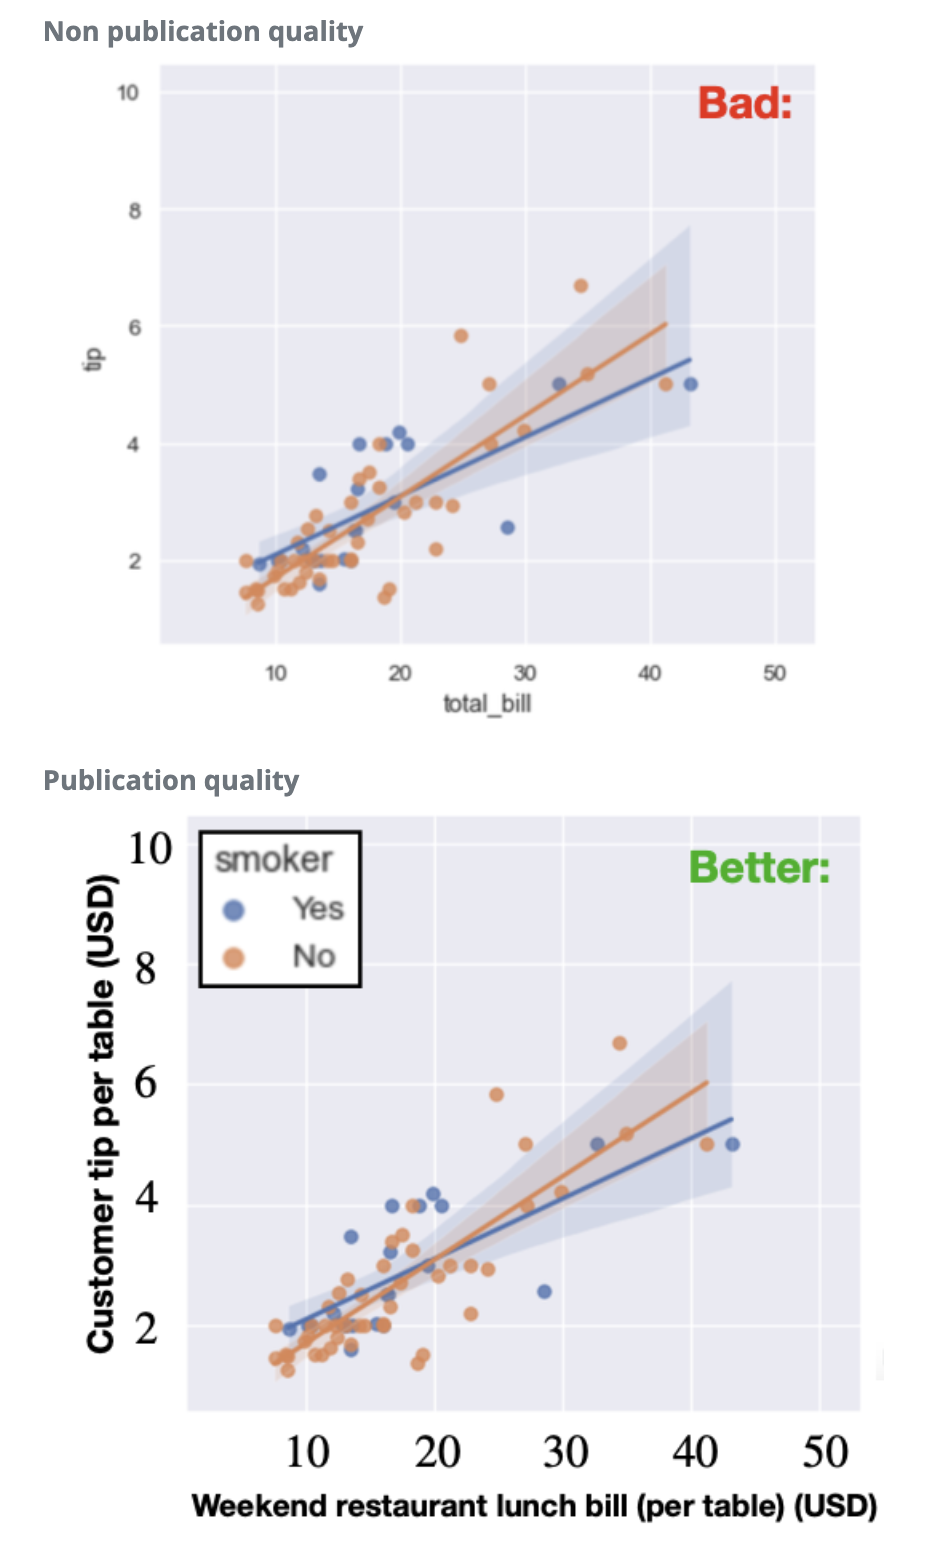
- Label everything: include a title, figure number, and fully labeled axes and legends
- Include units: “price” is bad; “Price of the S&P 500 index (USD)” is good
- Use large fonts: ~20 pt for labels and ticks, legible from the back of the room
- Caption each figure: two sentences below it stating the key takeaway
- Don’t over-plot: one or two messages per figure
- Always have a purpose: no plots for plots’ sake; each figure should strengthen the narrative
- No overlapping text: it looks sloppy and unprofessional
Influential figure: Nathan Yau
- Well known influencer in the data visualization community (and R guru)

Nathan’s basic rules for making charts and graphs
- Check the data
- Explain encodings
- Label axes
- Include units
- Keep your geometry in check
- Include your sources
- Consider your audience
Source: Flowing Data
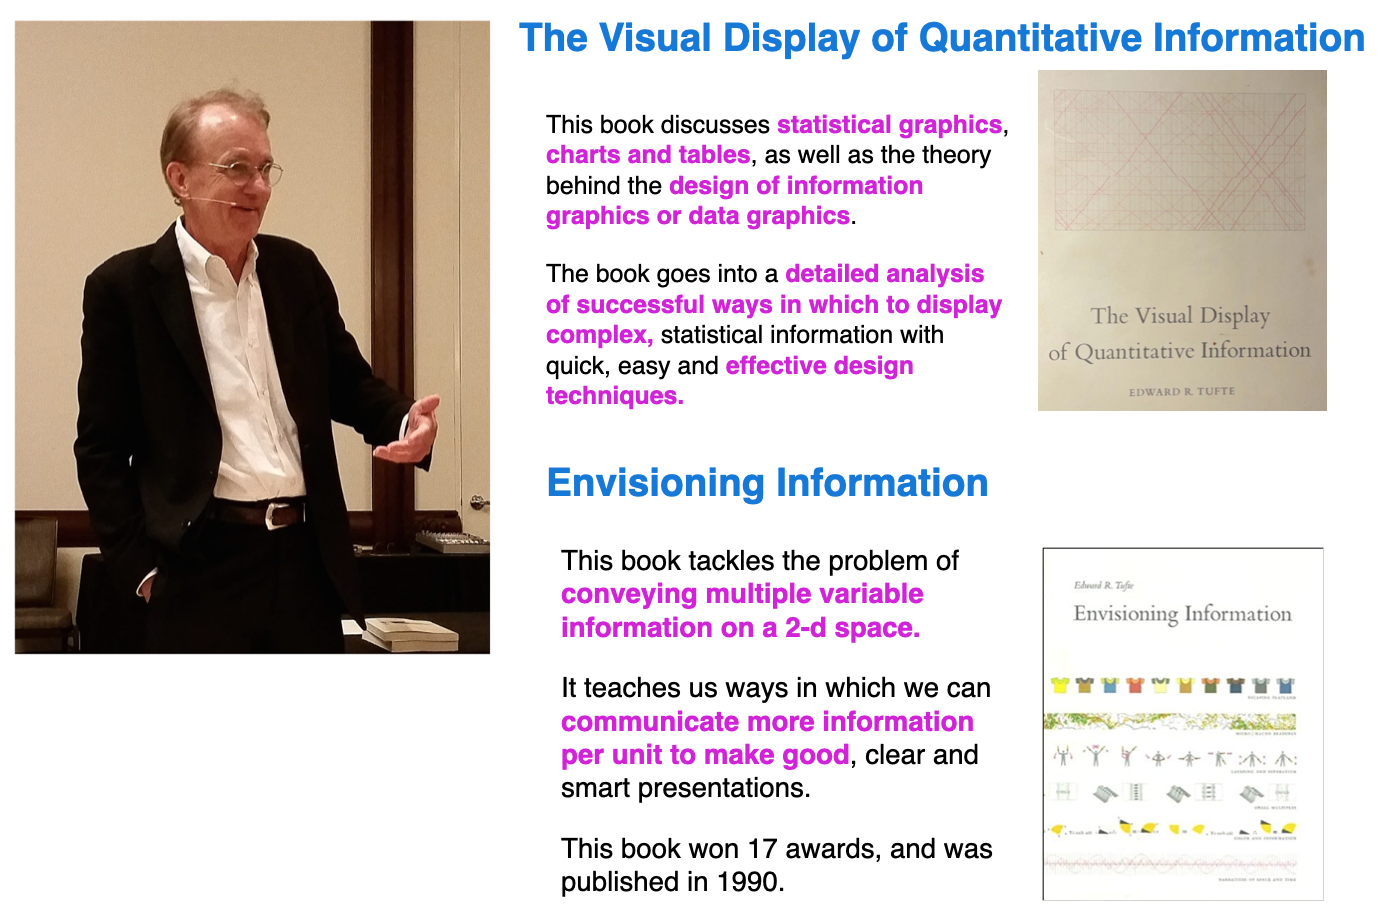
Influential figure: Ed Tufte
Ed Tufte is a statistician, professor and pioneer in the field of information design and data visualization.
Visualization encoding options
- These are options for different visualization methods (options NOT rules) \(\,\)
![]()