Motivation
- Why should you care about how computers store images and graphics?
- Images are data!! Understanding image data is the first step in understanding computer vision and other advanced applications
![]()
- This becomes very important with respect to
Convolutional Neural networks
Tensors
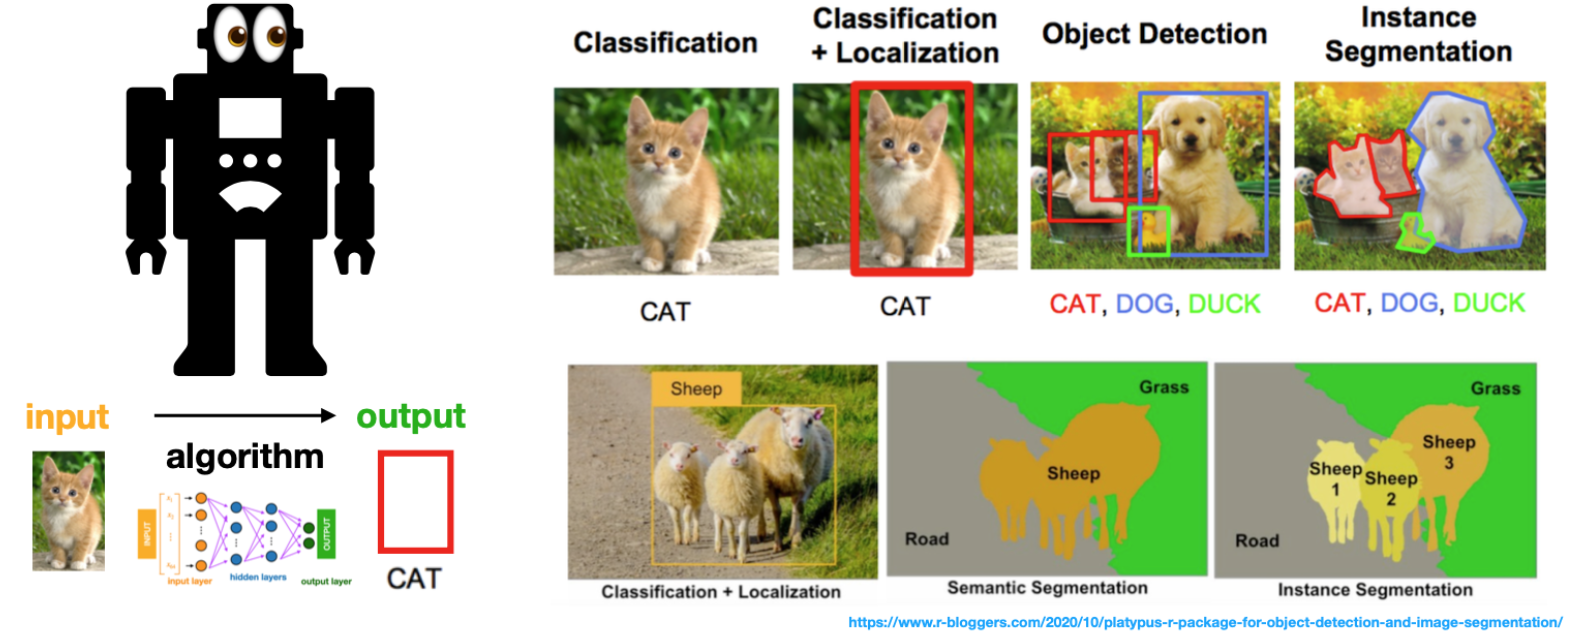
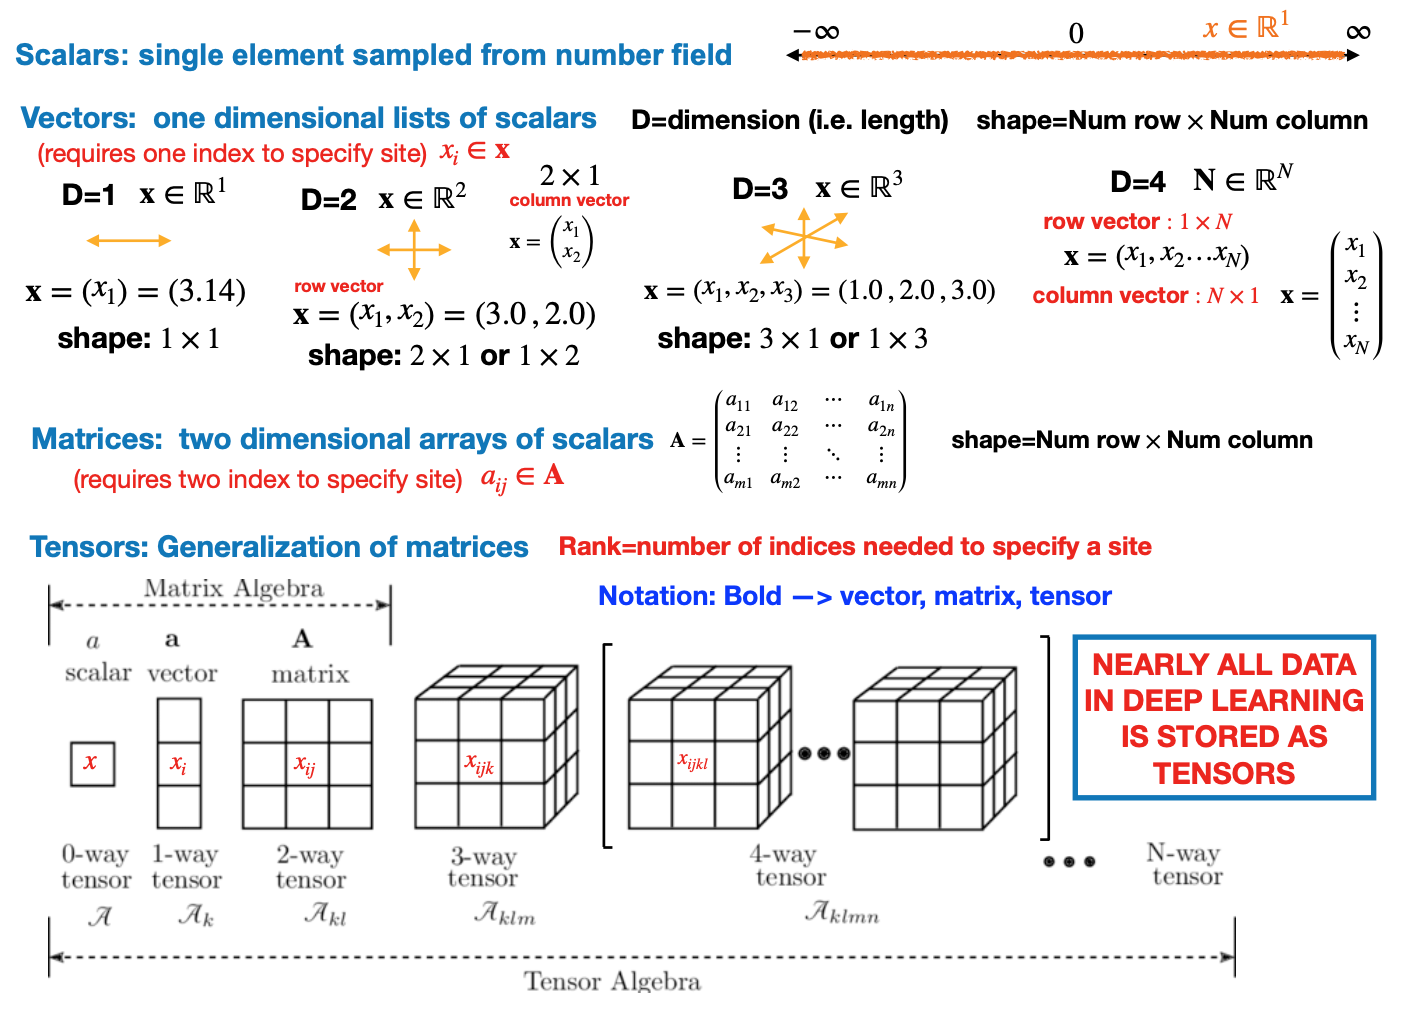
- Everything in deep learning is represented as a tensor (either numpy or torch)
![]()
Black and white screens
- Some basic concepts about screens can be useful for understanding computer vision
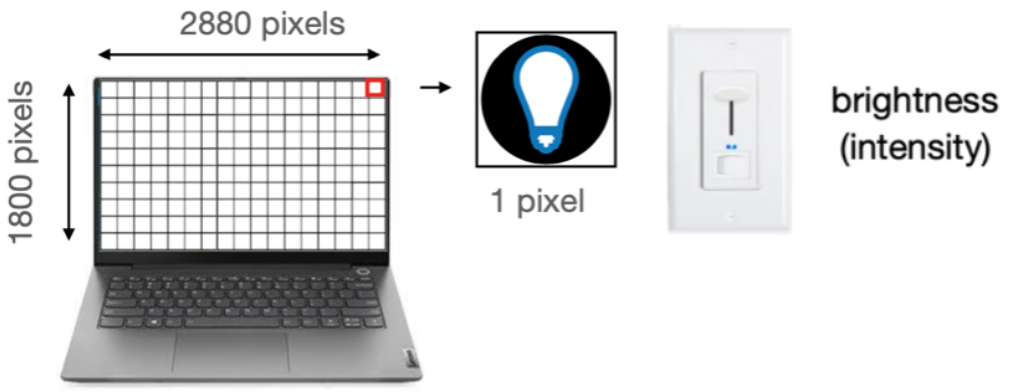
- In a black and white screen, pixels are variable light bulbs outputting white (mixed) light
![]()
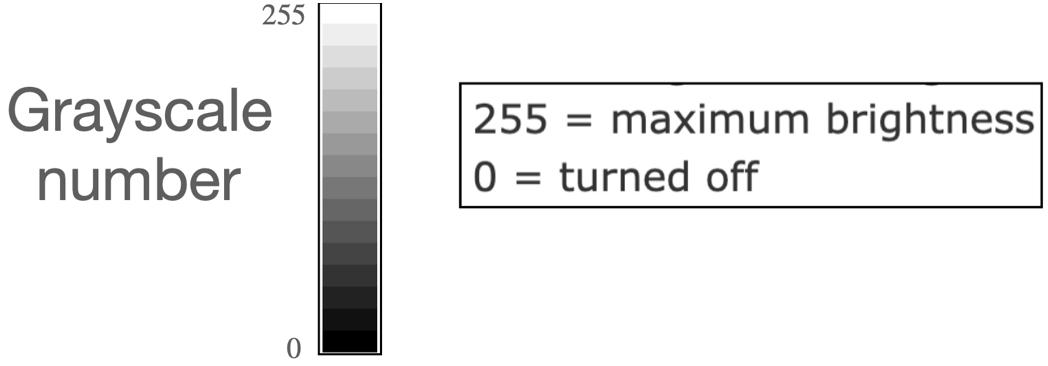
- The intensity of a pixel’s light is control by the gray-scale number.
- Numbers associated with colors are called
channels, gray-scale has one channel![]()
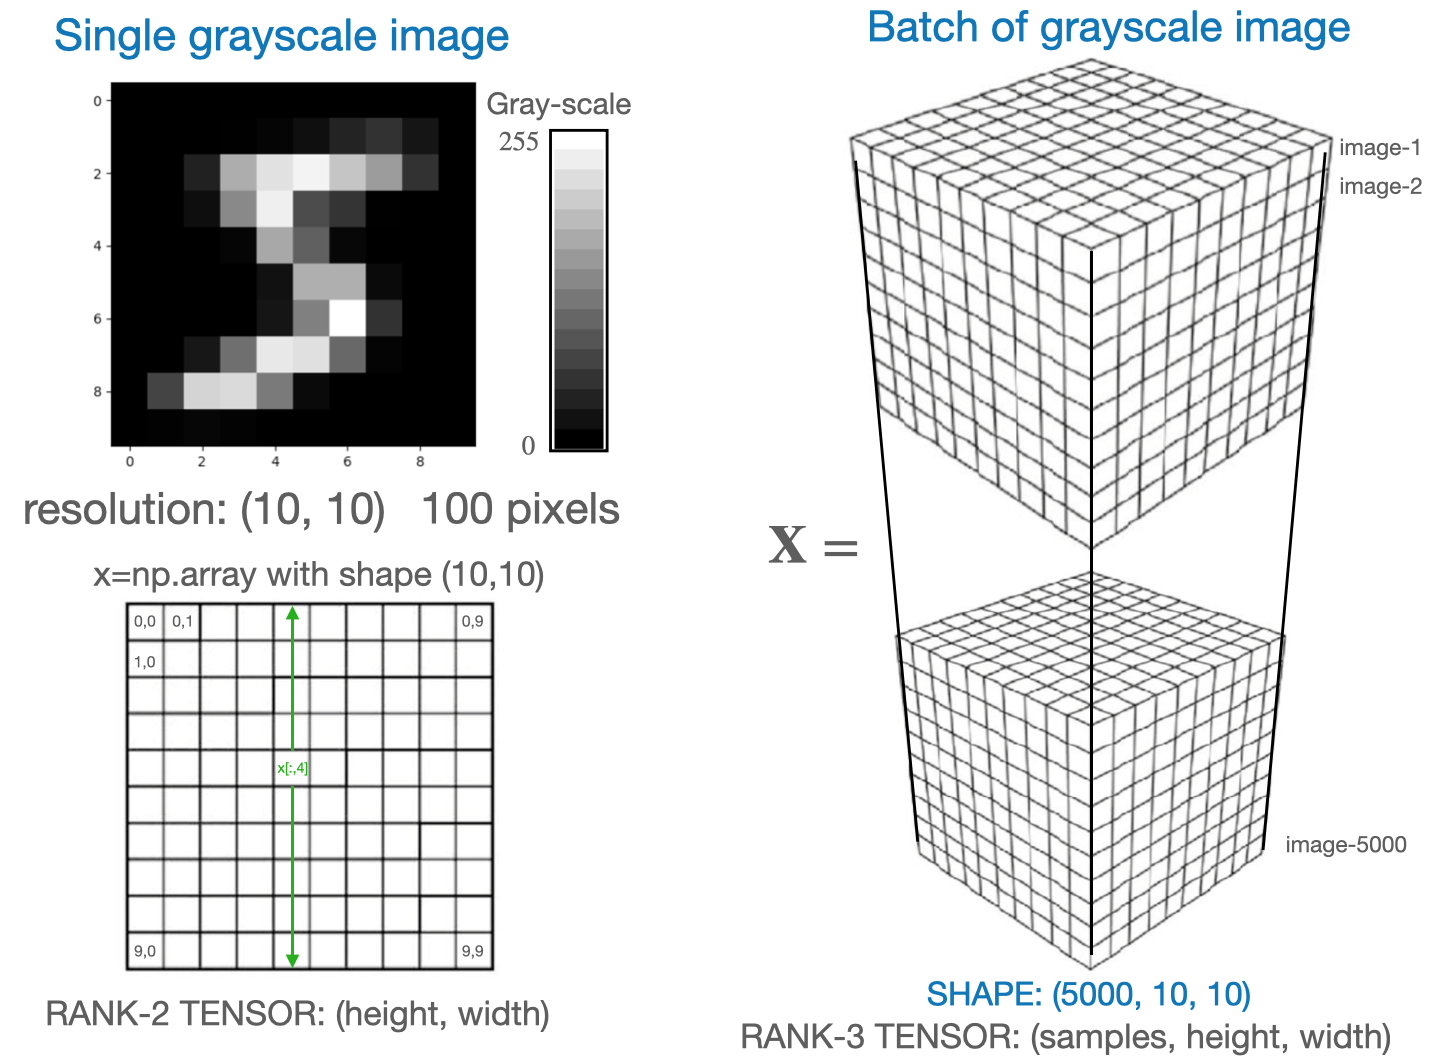
Grayscale images
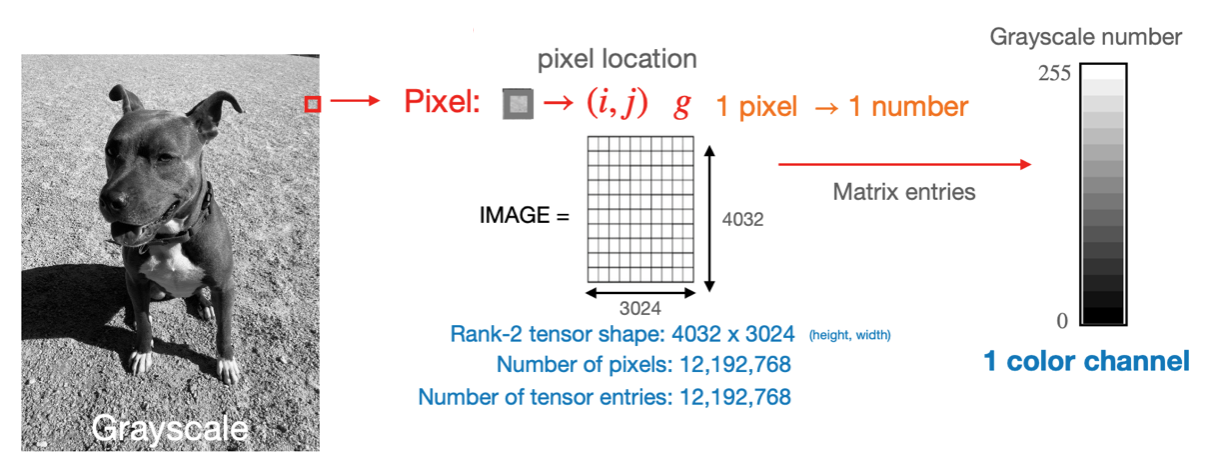
Black and white images are stored by specifying the gray-scale number for all the pixels
The pixel location is determined by its location in the matrix.
![]()
Note: The gray-scale image can also be expressed as a rank-3 tensor instead of a matrix[height, width]\(\rightarrow\)[height, width, channels], e.g.[10, 10]\(\rightarrow\)[10, 10, 1]
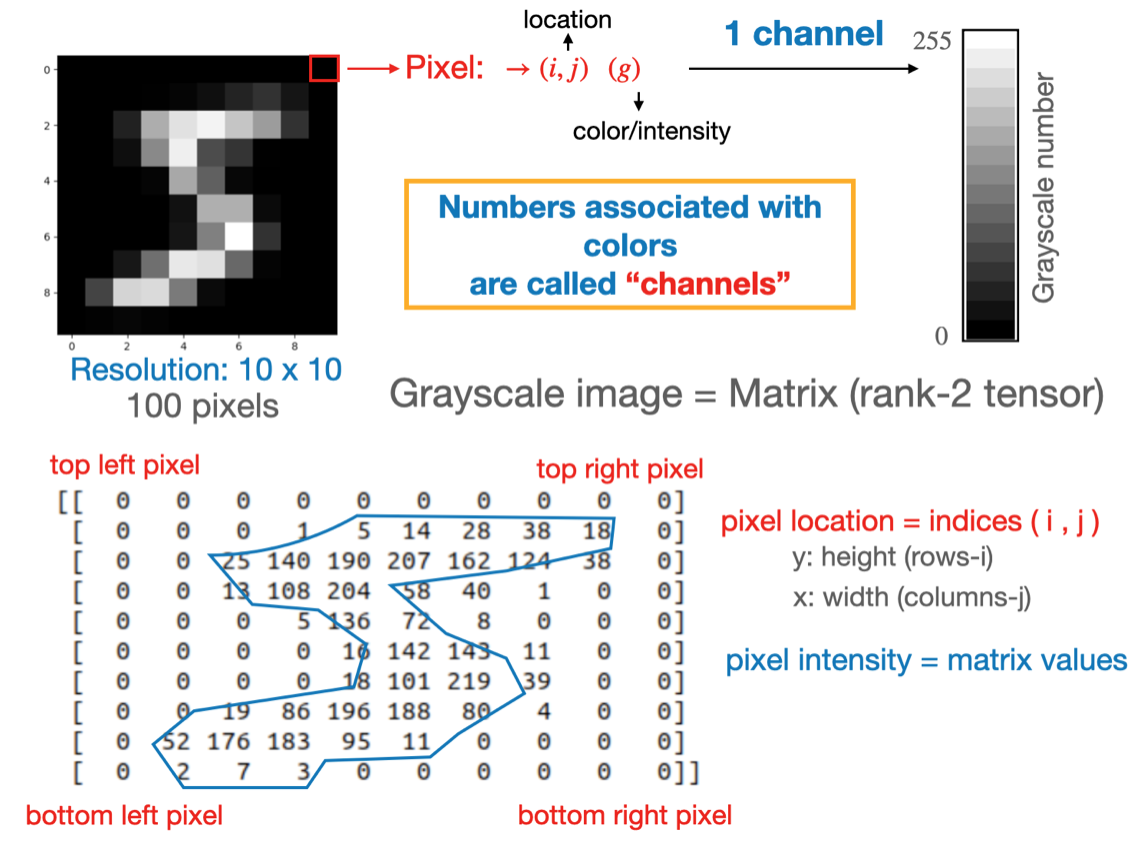
Image rendering
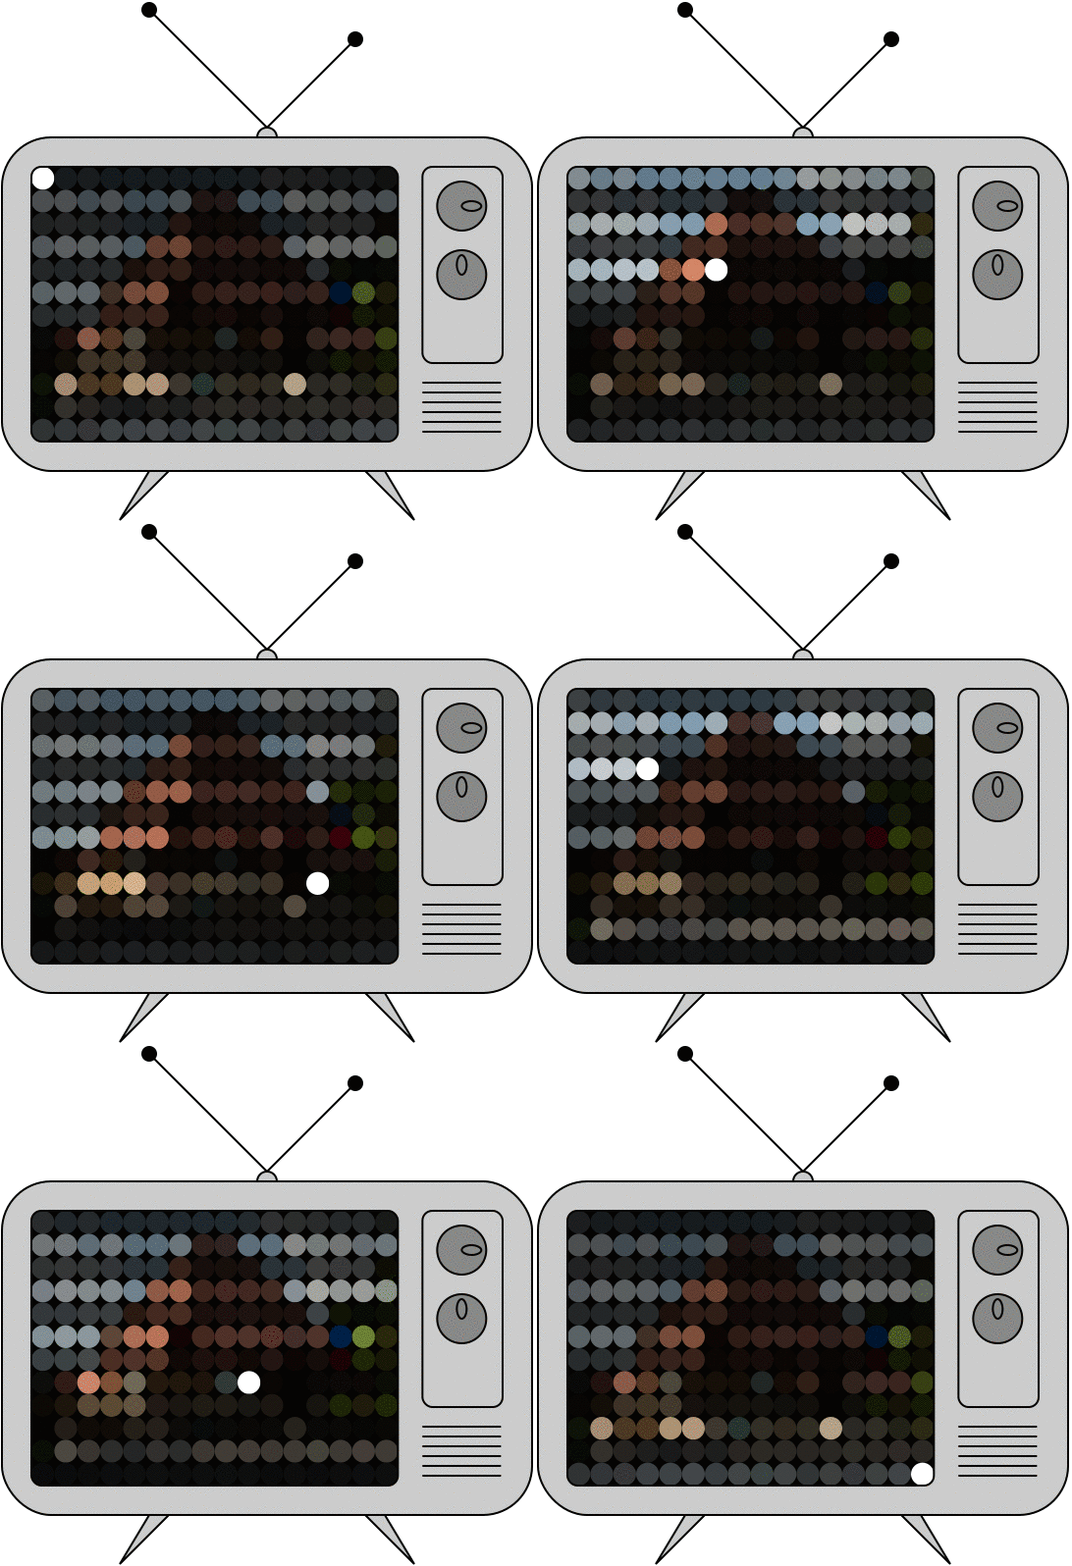
- Images show up on the screen by rastering accross the matrix and lighting up the relevant pixels one by one
Frame rate:The number of images (matrices), shown per second, in a videoRefresh rateIs the number of times per second the display draws a new image.- A refresh rate of 144Hz means the image refreshes 144 times per second.
- The human eye can see roughly 30 - 60 frames per second
- A refresh rate of 144Hz means the image refreshes 144 times per second.
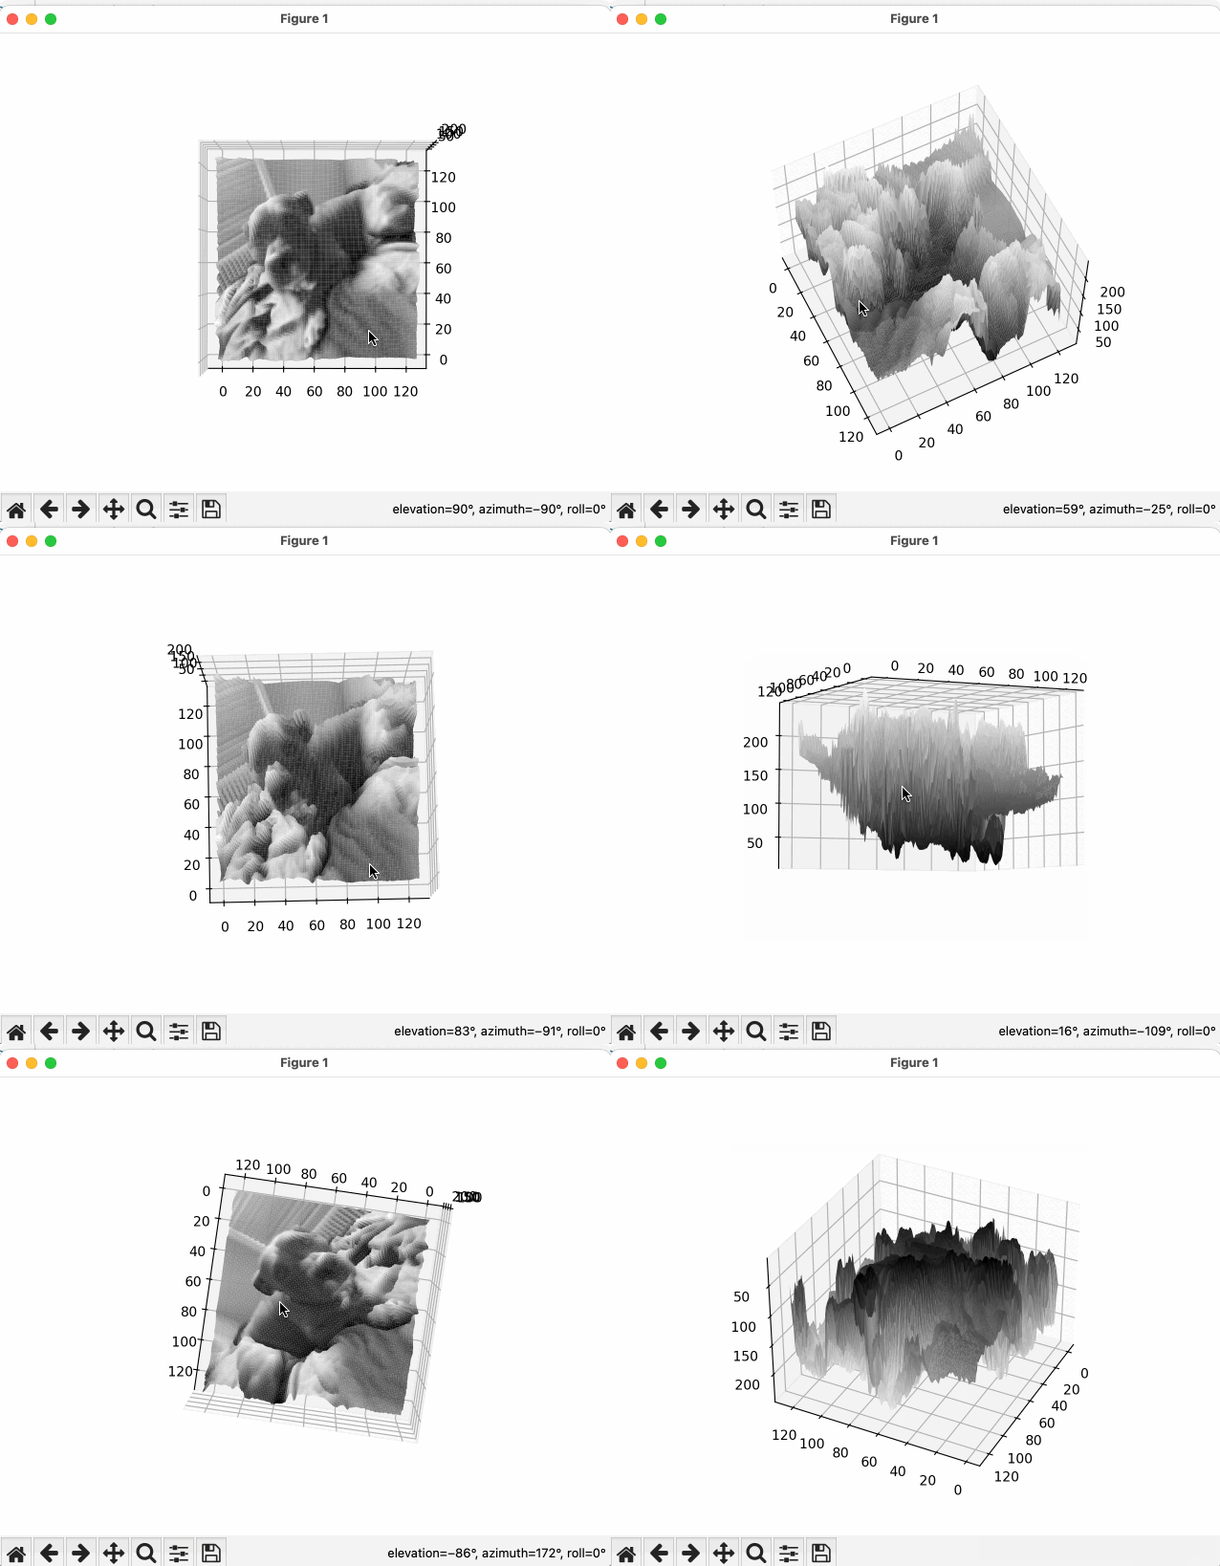
Aside: Images as 2D surface plots
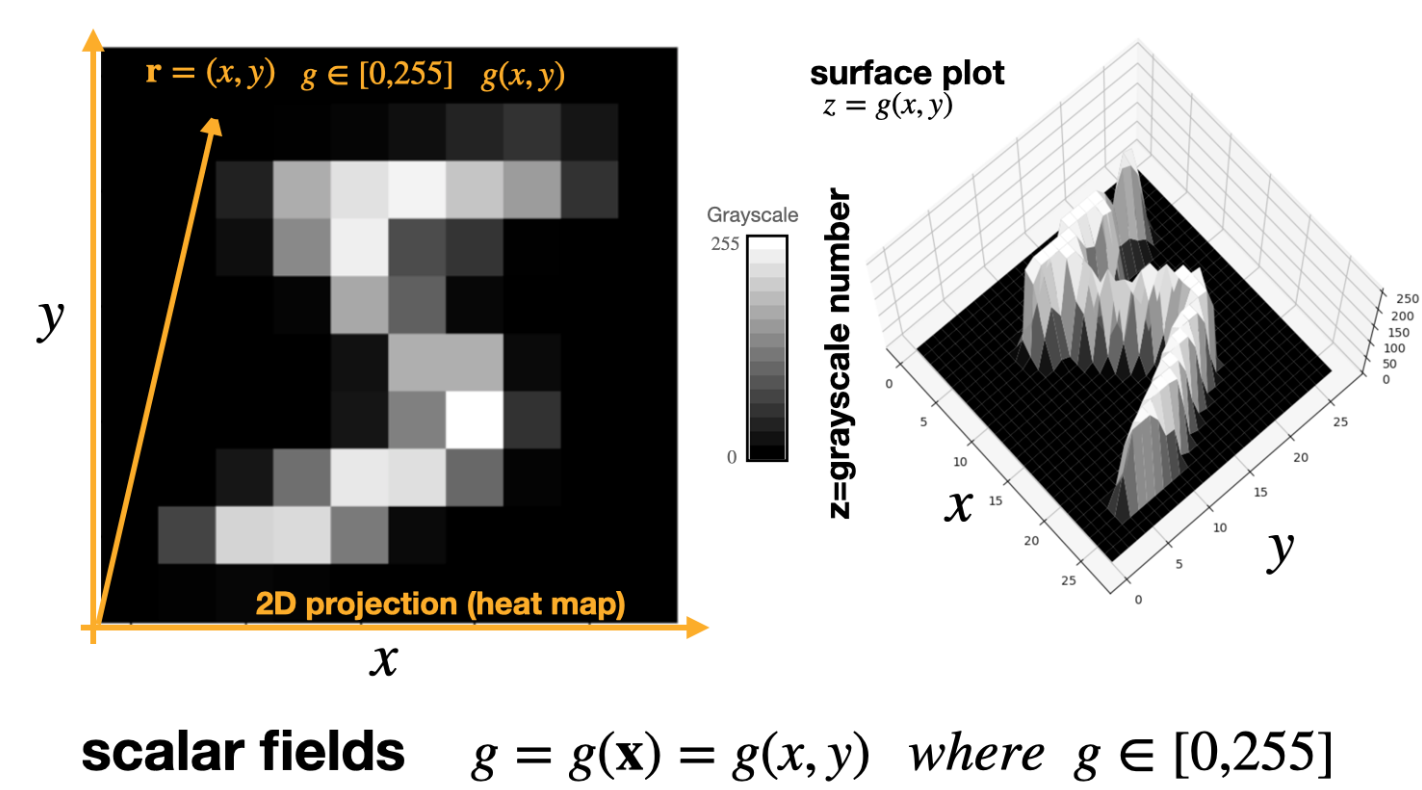
- A gray-scale image can be thought of as a function g of two spacial variables x and y (i.e. pixel location)
- This forms a scalar field \(g(x,y)\), with a gradient \(\nabla g=\left( \frac{\partial g}{\partial x}, \frac{\partial g}{\partial y}\right)\)
- Regions of large gradient correspond to large changes in intensity (edges)
Images as surfaces
- Here is another gray-scale image visualized as a surface
- For the surface plots, we can generate the plots in interactive mode, as shown in this gif
- This drives home the point the the gray scale image is a scalar field (i.e. a surface g, of two independent variable x and y) g(x,y)=gray_scale_intensity_value
- This function has a gradient (dg/dx, dg/dy)
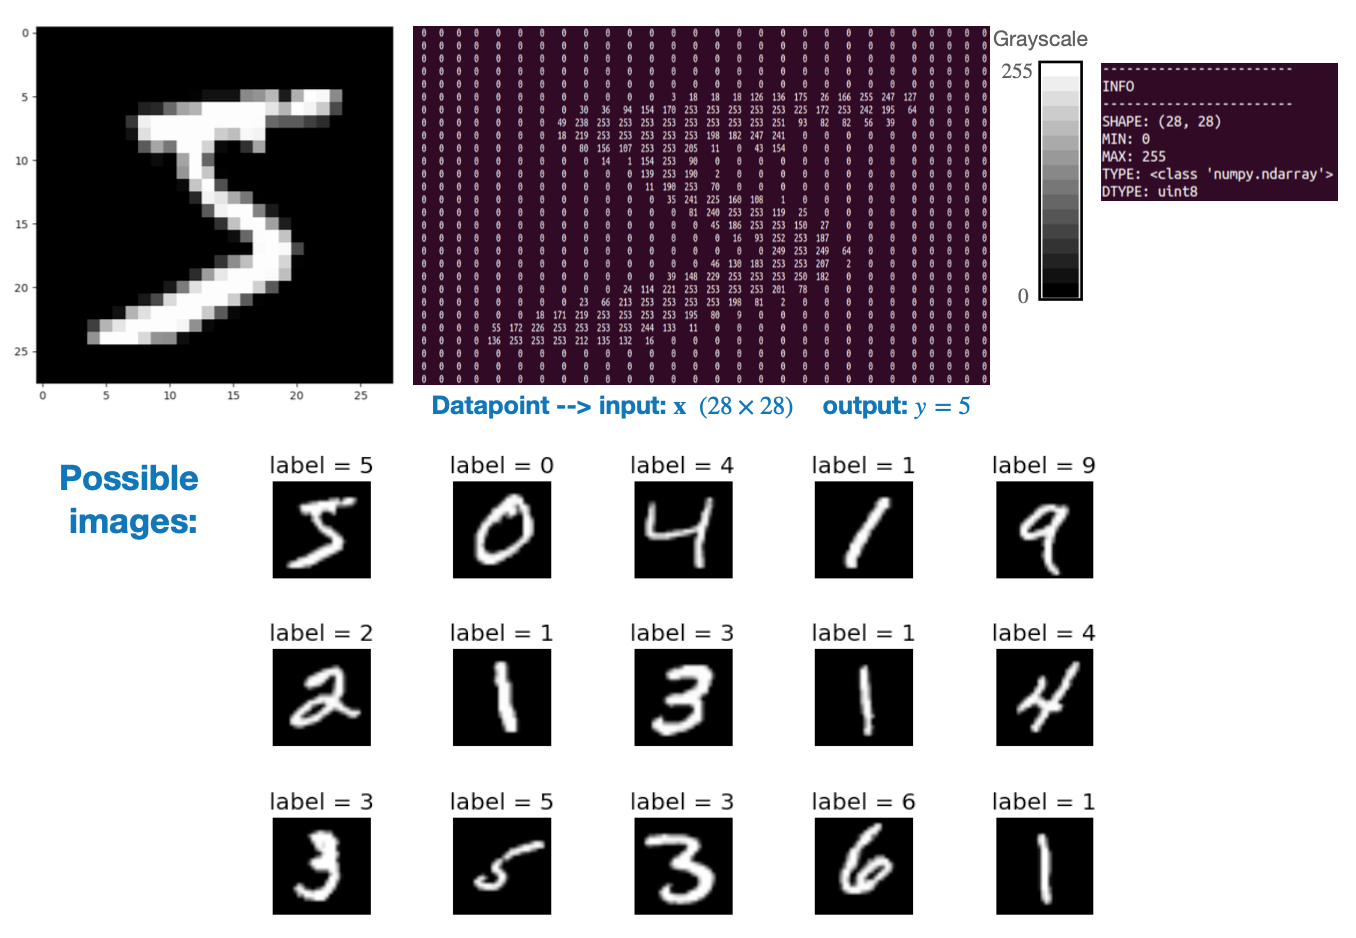
MNIST digits
- “True” MNIST, each image is stored as an 28x28 numpy array of gray-scale numbers
- “Sklearn” MNIST has only 8x8 pixels
![]()
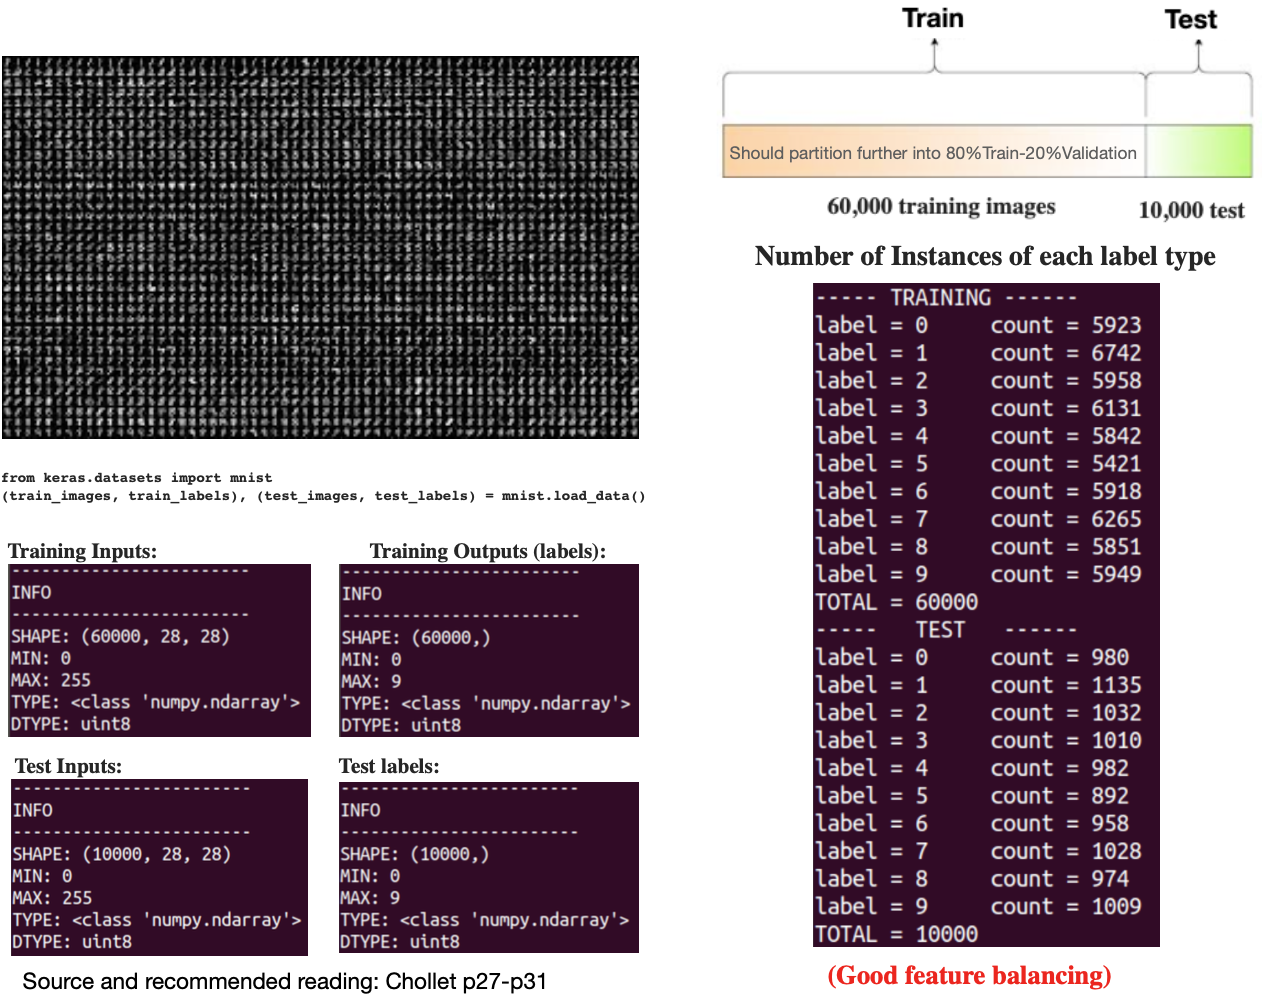
MNIST data-set
- The full MNIST data set has 60,000 images, well balanced across the classes
![]()
Batches of gray-scale images
- Data in deep-learning is
tensorizedby “stacking” samples in abatchdimension.- Similar to the “rows” dimension in a pandas data-frame
- The
batchdimension in deep learning represents the number of data samples processed together in one computational step.
Color images
Gray-scale images generalize naturally to color images.
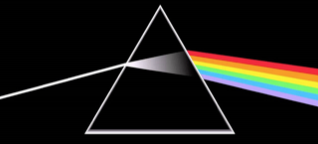
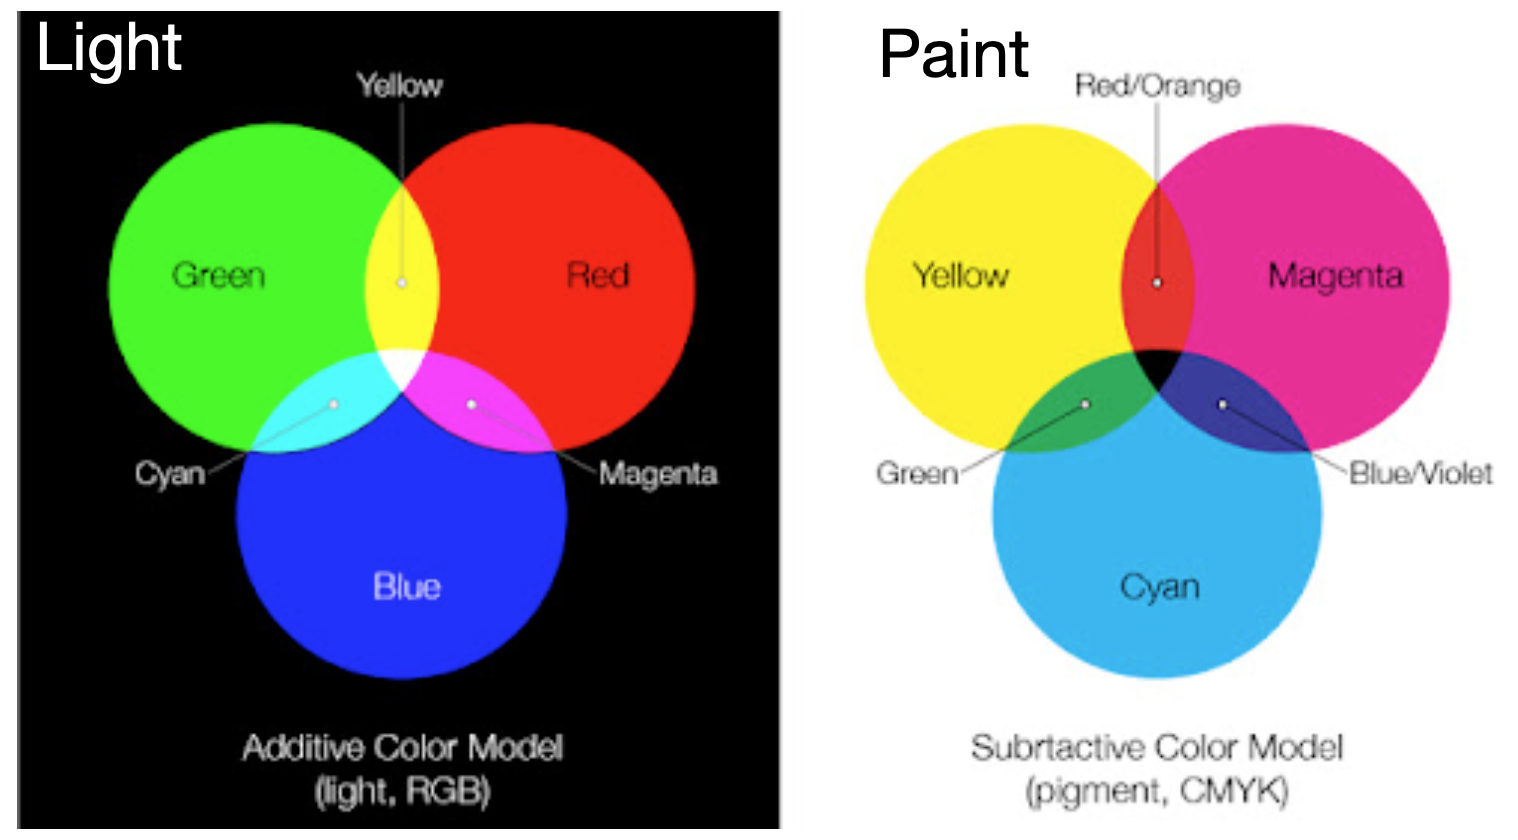
Color mixing
By mixing primary colors we can form all the colors of the rainbow
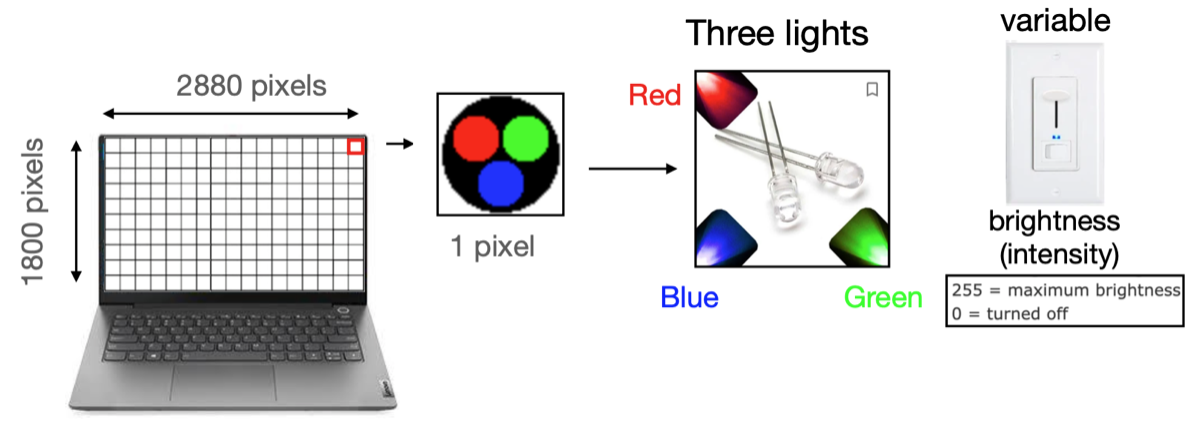
Color screens & pixels
- In a color screen the pixels are variable light bulbs outputting red, green, or blue light.
![]()
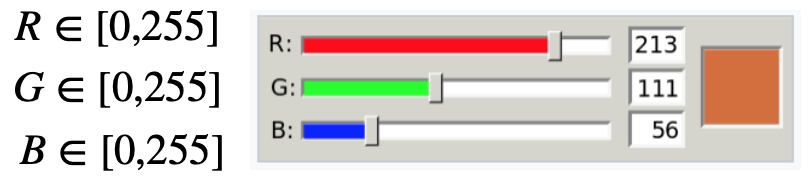
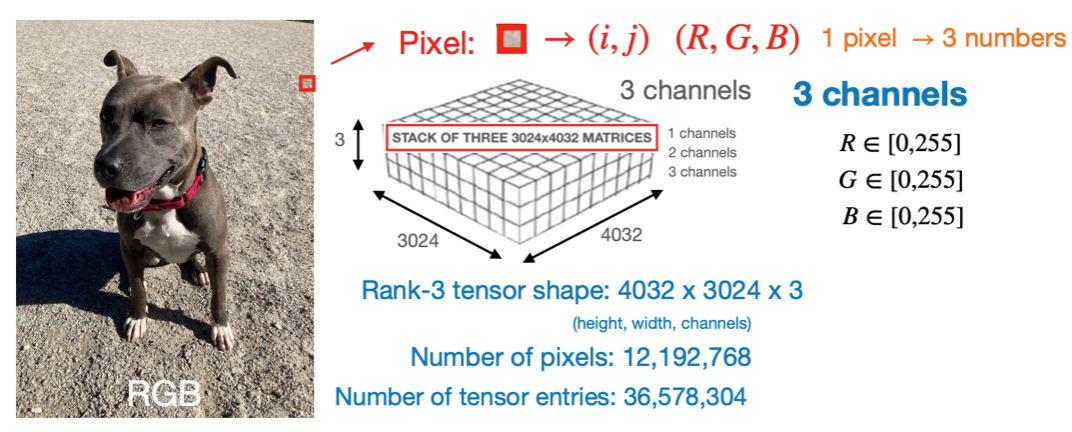
- We need three numbers (R,G,B) for each pixel to control the brightness of the 3 lights
- These three numbers allow us to form different colors through color-mixing
![]()
- There are \(255 \times 255 \times 255 = 16,581,375\) possible colors on the computer screen
Color examples-1
- Gray-scale is achieved by turning all three lights on at equal intensities \(R=G=B\)
![]()
- Primary colors: One light on at a time
![]()
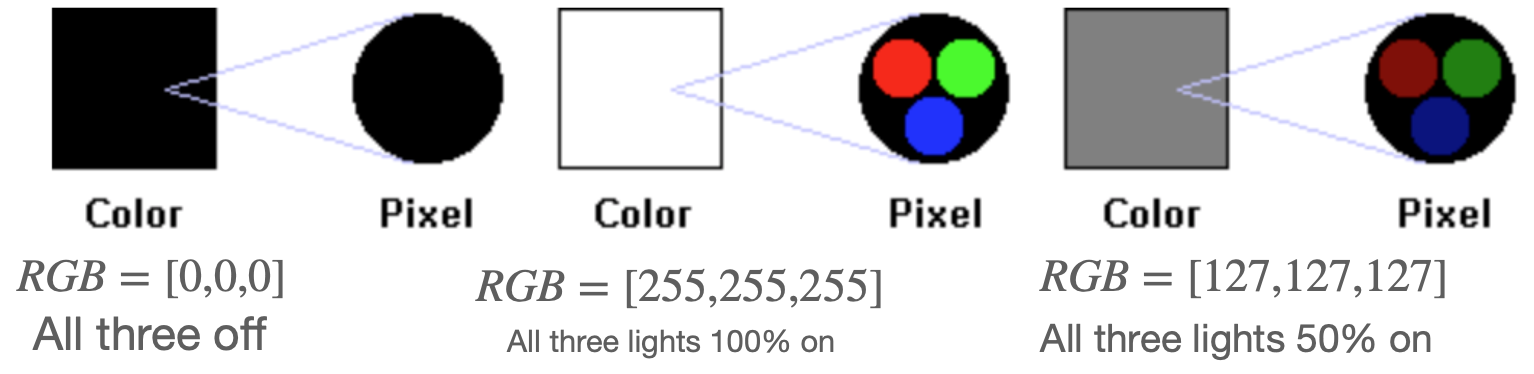
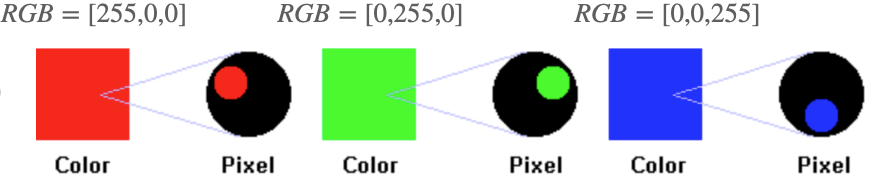
Image source: https://www.chem.purdue.edu/gchelp/cchem/RGBColors/body_rgbcolors.html
Color examples-2
- Secondary colors: Two lights on at a time with equal intensities
![]()
- General colors: Three lights on at a time with different intensities
![]()
![]()


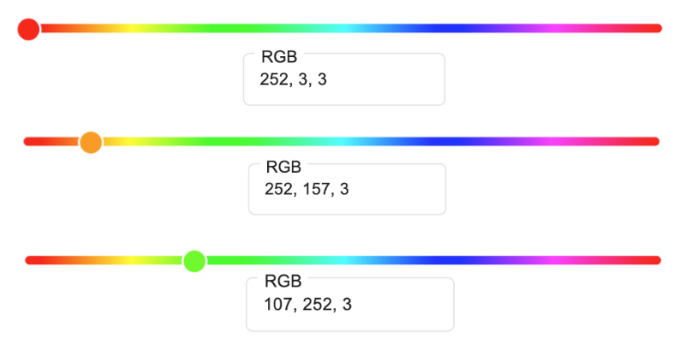
Image source: https://www.chem.purdue.edu/gchelp/cchem/RGBColors/body_rgbcolors.html
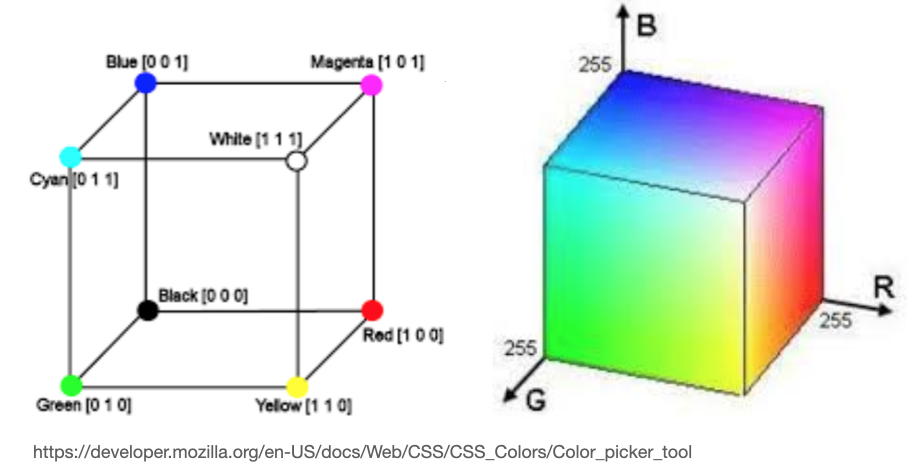
RGB Color cube
- Grayscale \(\rightarrow\) main diagonal (R=G=B)
- Secondary \(\rightarrow\) two lights on at full intensity (outer surface)
- mixed \(\rightarrow\) three lights w/ different intensity (cube interior).
![]()
Alternate color representations
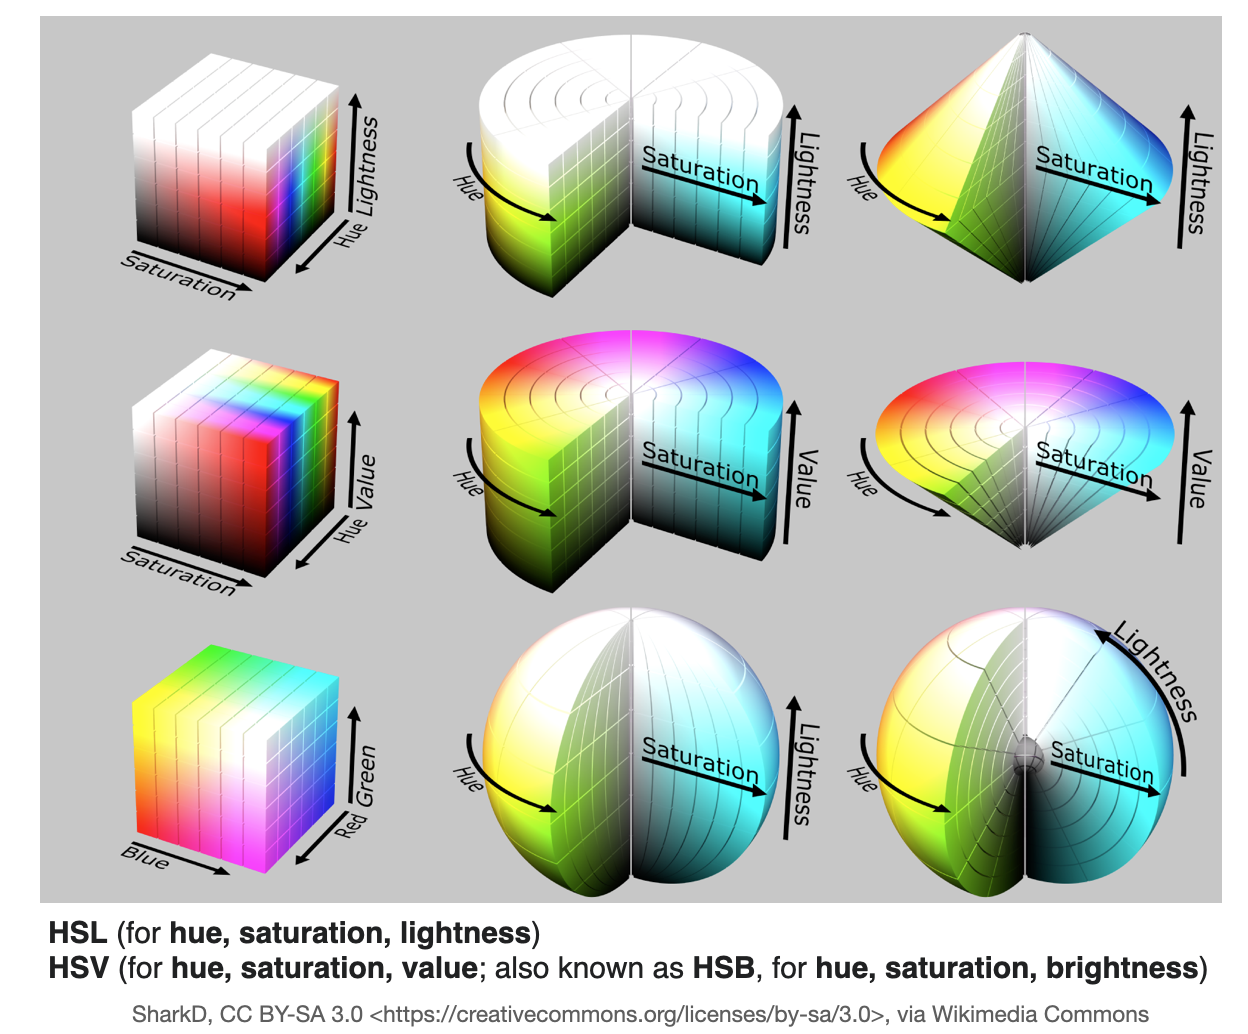
Sometimes you may encounter alternatives to the RGB color scheme, e.g. HSL and HSV
Example: Color image
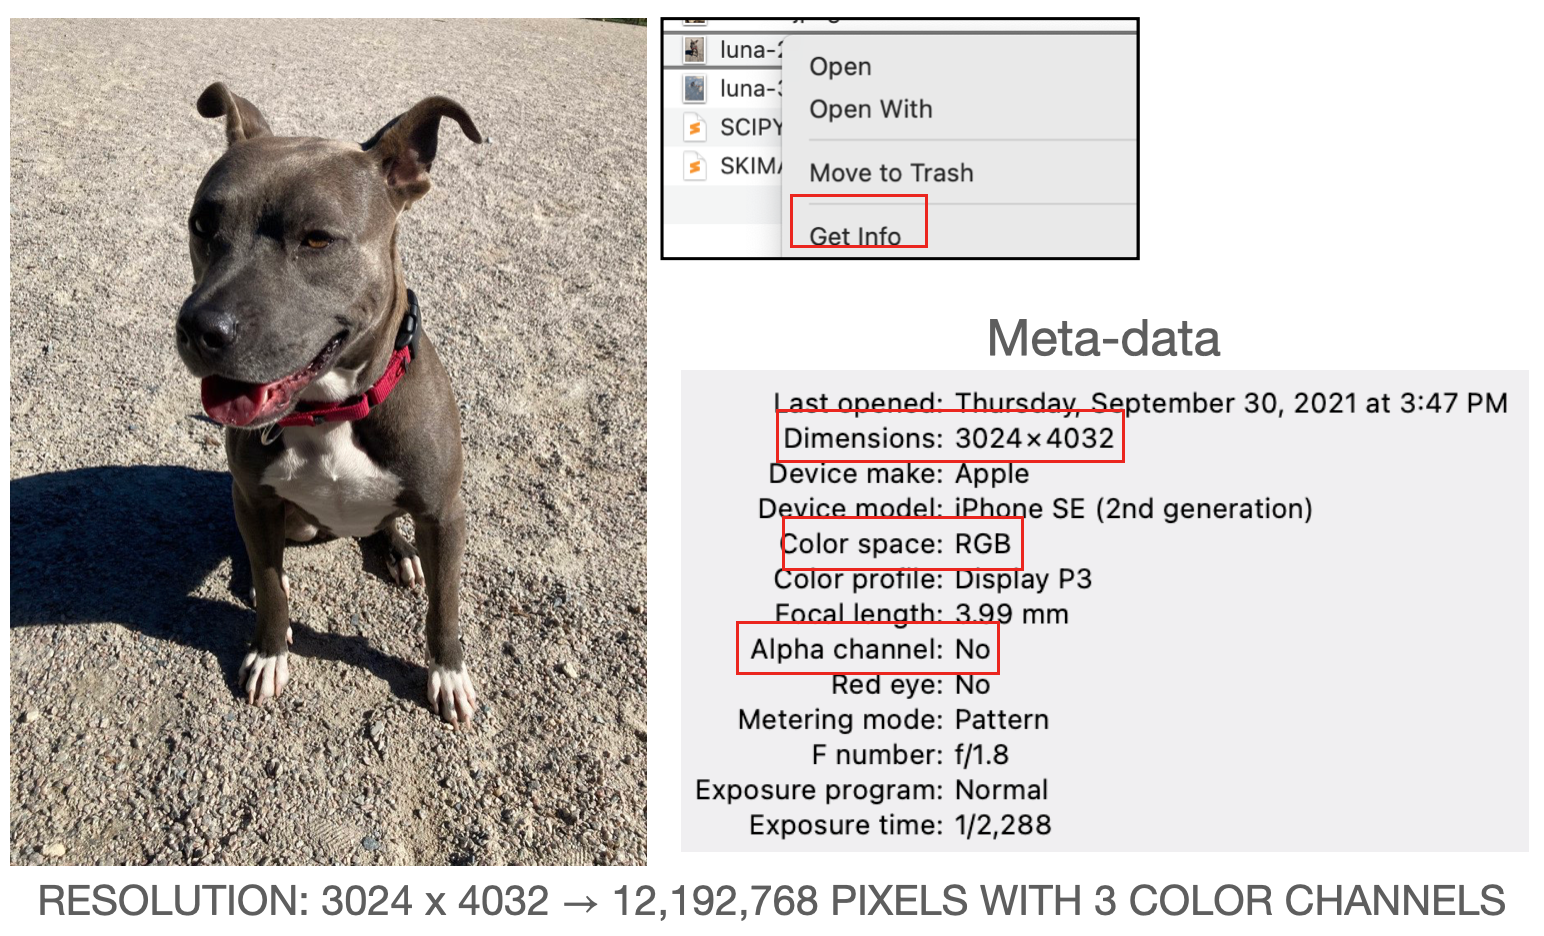
- Color image’s are vector fields: \(\mathbf{C}=(R, G, B)=\mathbf{C}(\mathbf{r})=\mathbf{C}(x, y)\)
Mathematical description
- Grayscale: matrices (e.g.
np.shape=(320,120) or np.shape=(320,120,1)).
![]()
- RGB: Rank-3 tensors (stack of matrices)(e.g.
np.shape=(320,120,3)).
![]()
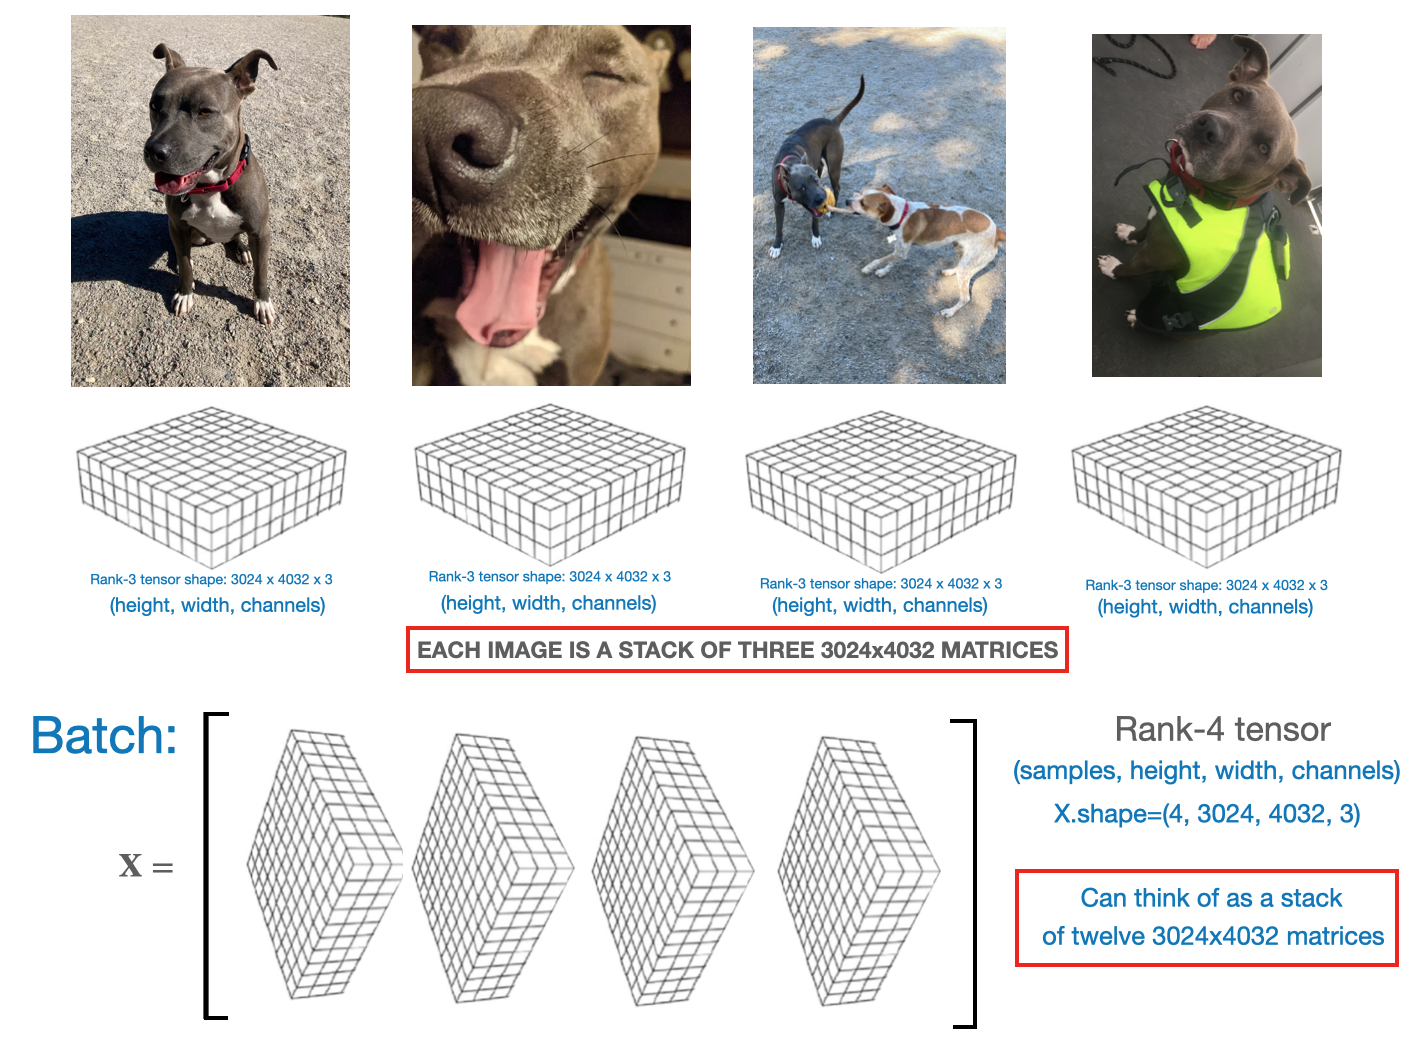
Batch of color images
- Similar to gray-scale, we can “stack” the
rank-3tensors into abatch, to form arank-4tensor Note:Here we are showing the images using theKerasimage convention[samples, height, width, channels], in PyTorch it would bebatch_size, channels, height, width].
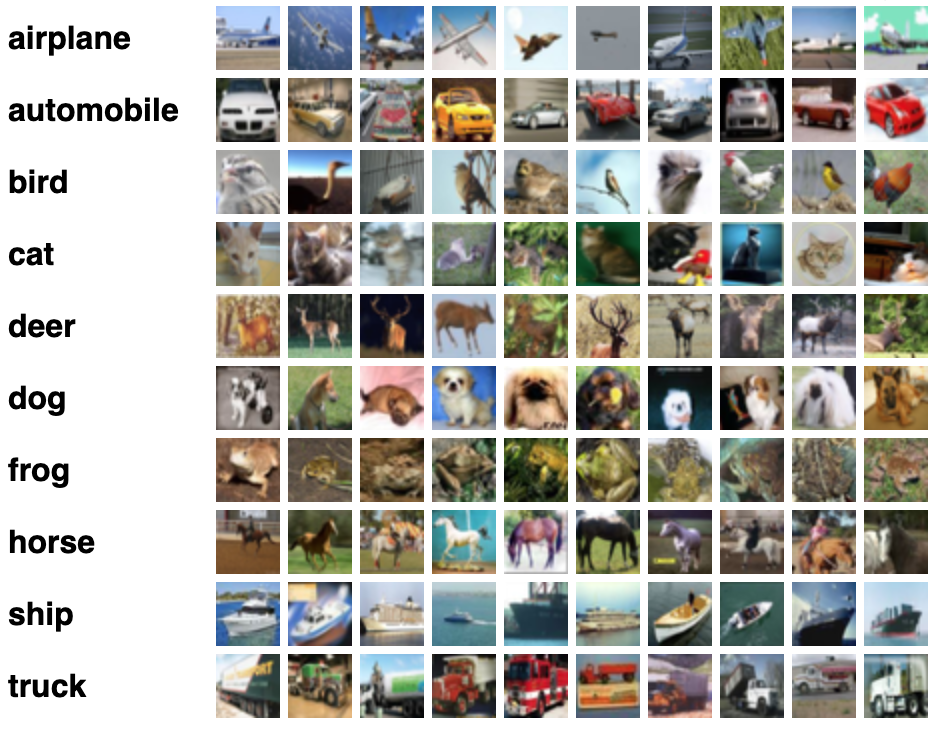
CIFAR-10
- This is a dataset of \(50,000 color images with 32 \times 32\) resolution and 10,000 test images, labeled over 10 categories.
- See the CIFAR homepage for more info click here