Understand what problem GraphSAGE was invented to solve
Understand the three step recipe: sample, aggregate, update
Walk a complete numerical example from raw features all the way to a loss value
Build a working model in PyTorch Geometric
What you should already have
Comfort with vectors and matrix multiplication
A rough idea of what a neural network layer does
Familiarity with gradient descent and cross entropy loss
What we will not cover
Formal proofs of expressive power
Heterogeneous graphs, temporal graphs, or graph level prediction
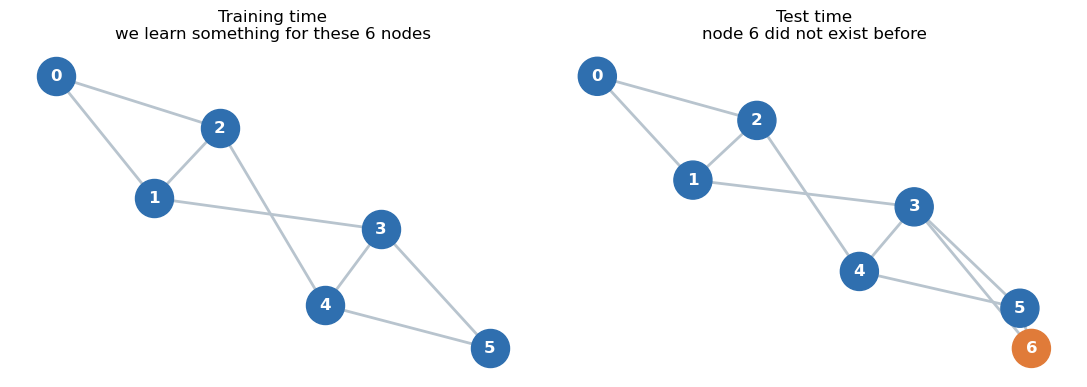
Recall: Transductive vs. Inductive Learning
Transductive Learning
Learns an embedding for each node directly (creates a lookup table)
Cannot generate embeddings for new/unseen nodes
Inductive Learning
Learns a function to generate embeddings based on node features and structure
Can compute representations for new/unseen nodes without retraining
The Problem with Lookup Table Methods
Transductive approaches:
- Learn a unique embedding for each node—stored in a lookup table (e.g., DeepWalk, node2vec) - The model is ultimately just a matrix \(Z\) (one row per node) - Training = directly updating these node-specific rows - Again, think \(T-SNE\) flavor, where we retrain the embedding for each new points
Limitations:
- No vector exists for new nodes; cannot embed them - Only solution: retrain or re-optimize on the whole graph - Parameter count scales linearly with node count
Real-world impact:
- Large dynamic graphs (Reddit posts, Pinterest pins, fraud accounts) constantly add new nodes - Constant retraining is infeasible and inefficient
The Two Problems GraphSAGE Solves
Introduced by Hamilton, Ying, Leskovec (2017) to address:
1. New Nodes (Inductive Learning)
Embed unseen nodes without retraining the model
2. Scalability
Full-graph methods can’t handle massive graphs in memory
Necessary for dynamic graphs (e.g., social platforms, recommendation systems)
Key idea
Learn a shared function (neural aggregator) instead of per-node embeddings
Parameters are function weights, not node vectors
Applies to any node—seen or unseen
Operates on local neighborhoods; efficiently runs in mini-batches
General overview of the method
Recall; Message Passing Formalism
Node representations are updated by exchanging information through edges
Each node aggregates messages from its local neighbors
General message passing update:
For target node \(v\):
Gather: collect representations from neighbors \(u \in \mathcal{N}(v)\)
Aggregate: combine neighbor information (e.g., mean, sum, LSTM)
Update: merge aggregated message with \(v\)’s existing representation
Framework underlies GCN, GAT, GraphSAGE, and many other GNNs
Big picture: Sample, Aggregate, Update
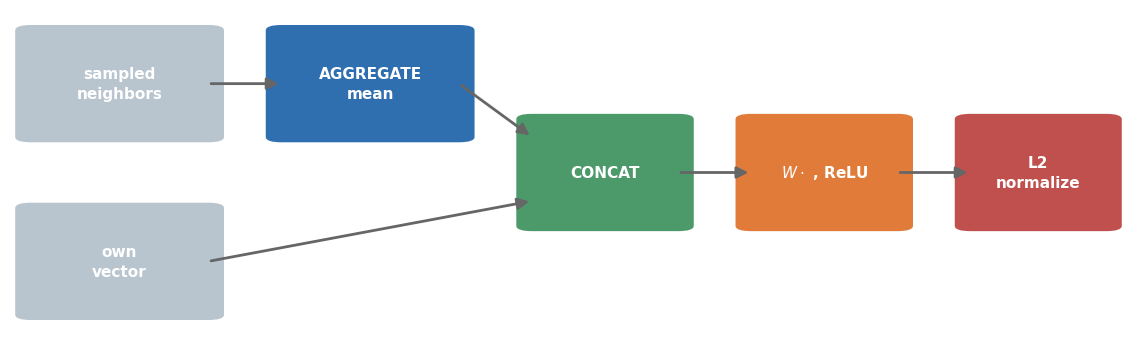
The name GraphSAGE comes from SAmple and aggreGATE. Every layer does three things for a target node \(v\).
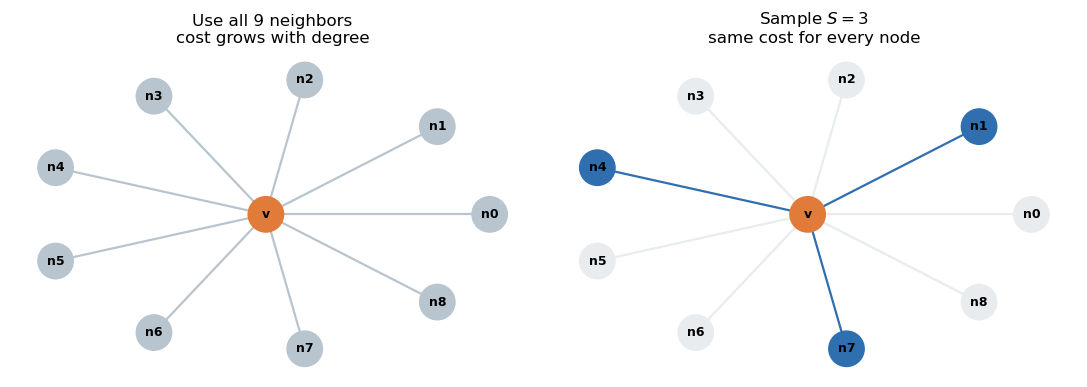
Sample: Select a fixed number (e.g., 10) of neighbors for node \(v\) uniformly at random; ignore others.
Aggregate: Merge sampled neighbor vectors into one summary—commonly by elementwise mean.
Update: Combine the neighbor summary with \(v\)’s vector, apply a learned weight matrix and nonlinearity.
Stacking layers allows information to propagate from further neighborhoods.
Summary: A node’s updated embedding is a learnable blend of its own features and aggregated knowledge from its sampled neighbors.
Step 1: Sample the Neighborhood
Importance of Sampling
Problems with using all neighbors
Real graphs: highly variable node degrees
Example: most Twitter users follow hundreds; celebrities, millions
Large-degree nodes in a batch can cause memory spikes
Advantages of fixed-size sampling
Constant per-node cost—predictable batch sizes
Memory/compute become tunable hyperparameters, not data-dependent
Adds randomness, acting as regularization (like dropout)
Practical points
Neighbors are sampled uniformly from \(\mathcal{N}(v)\)
If \(|\mathcal{N}(v)| < S\), sample with replacement to always get \(S\)
Sampling is redone at each training step, covering the full neighborhood across epochs
Key intuition: Sampling provides a Monte Carlo estimate of aggregating all neighbors: noisy short term, accurate on average.
Step 2: Aggregate
Given \(S\) sampled neighbor vectors, aggregate them into a single summary vector.
Key requirement: Aggregation must be permutation invariant (order does not affect result).
Neighborhood is a set, not an ordered list.
No meaningful order among neighbors.
Order-dependent functions yield inconsistent outputs for the same graph.
Example:
If \(z = [3, 4]\), then \[\|z\|_2 = 5,\;\;\; \hat{z} = \left[\frac{3}{5}, \frac{4}{5}\right] = [0.6,\;0.8]\]
Direction unchanged; length is now 1.
Stacking Layers: Fanning effect from sampling
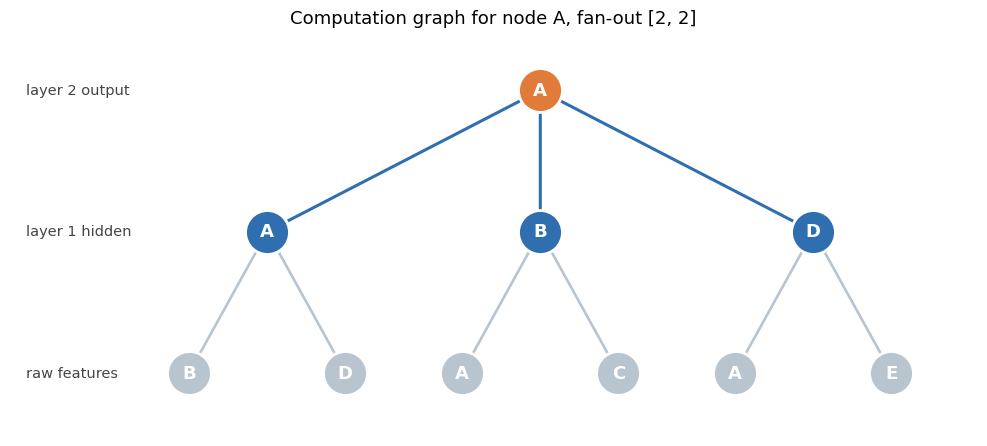
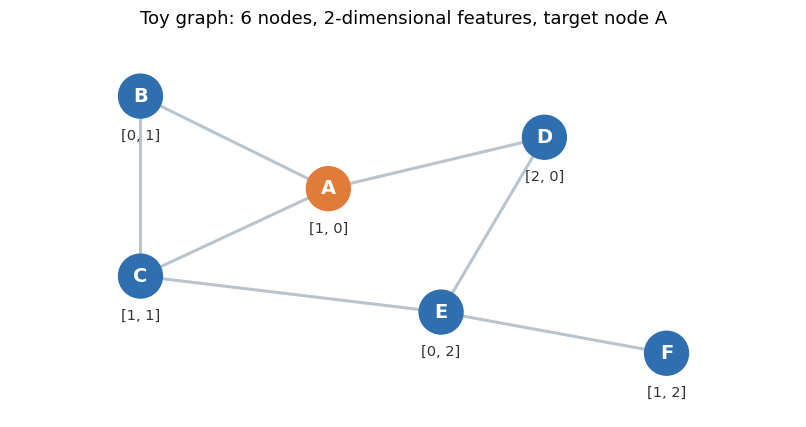
To compute node A’s layer 2 embedding:
Need layer 1 embeddings for A and sampled neighbors B, D
Each layer 1 embedding depends on the raw features of its own sampled neighbors
The process forms a small computation tree, traced backward from the target node
Interpretation - Embedding at layer \(K\) draws from nodes up to \(K\) hops away (receptive field)
Computation Cost - With fan out \([S_1, S_2, \dots, S_K]\), number of nodes per tree: \[
1 + S_1 + S_1S_2 + \dots \approx \prod_{k=1}^K S_k
\] - Where \(S_k\) is the number of neighbors sampled at layer \(k\) - Example: Fan outs - \([10, 10]\) ≈ 100 nodes per target - \([10, 10, 10]\) ≈ 1000 - Paper suggests \(K=2\), \(S_1 \cdot S_2 \leq 500\)
Depth tradeoff - More layers = wider reach, but too much depth (\(>2\)–\(3\)) causes oversmoothing: all embeddings converge and lose distinction
Why Mini-Batching Matters
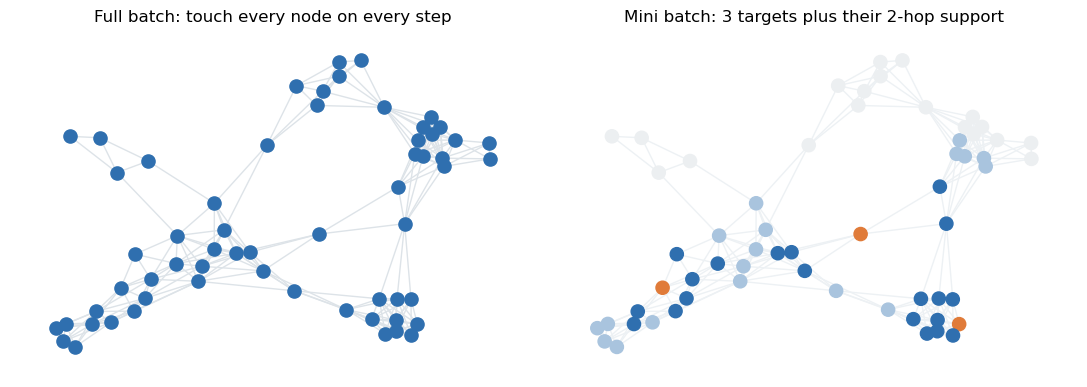
Full graph methods:
Load entire graph and features in memory
Recompute all node embeddings each step
Impractical for large graphs
GraphSAGE:
Sample a batch of \(B\) target nodes
For each, sample their \(K\)-hop neighborhoods (fan out \([S_1, ..., S_K]\))
Batch size is proportional to \(B \cdot \prod_k S_k\), independent of total graph size
Compute loss and backprop on targets only
Consequences:
Memory and compute scale with batch size, not graph size
Graph can be kept on disk or in distributed storage
Training scales with labeled data, not total nodes
Inference:
Use full neighborhoods at prediction time; no need for sampling
Sampling with Limited Neighbors
\(S\): sample size (fanout); \(N(v)\): neighbor set of node \(v\)
If \(|N(v)| < S\), two sampling options:
With replacement (replace=True):
Sample \(S\) nodes, allowing repeats
Fixed output size; original GraphSAGE approach; efficient for GPU batching
Without replacement (replace=False):
Return all \(|N(v)|\) neighbors (may be fewer than \(S\))
Default in PyG/DGL; produces variable/neighborhood sizes; requires padding and masking
Special cases:
Isolated nodes (\(|N(v)| = 0\)): use self-loop or zero vector for aggregation
With replacement: consistent shapes, but duplicated neighbors
Alternative Aggregators
Key hyperparameter; classic options:
Mean \[\text{AGG} = \frac{1}{|S_v|}\sum_{u \in S_v} h_u\]
Simple, robust default
Ignores neighbor counts
Max Pooling \[\text{AGG} = \max\left(\left\{\, \sigma(W_{\text{pool}} h_u + b) : u \in S_v \,\right\}\right)\]
Passes neighbors through a small network, then elementwise max
Effective to detect if any neighbor has a feature
More parameters; may overfit
LSTM
Sequentially aggregates neighbors (random order each batch)
Highest capacity; not fully permutation invariant
Guidance: Use mean by default; try max pooling if outlier neighbors are important.
Key Hyperparameters
Layers (\(K\)): Usually 2–3; more layers risk oversmoothing.
Fan out \([S_1, S_2]\): Typical values \([25,10]\) or \([10,5]\); higher values reduce variance but increase compute. Keep total under a few hundred.
Hidden dimension: 64–256; larger = better for rich graphs, prone to overfit on small graphs.
Aggregator: Mean (default), or max pooling for “any neighbor” detection.
Node classification: what category is this paper, is this account fraudulent
Node regression: predict a continuous quantity per node
Link prediction: score a candidate edge as \(\sigma(z_u^{\top} z_v)\)
One thing to watch
Labels are often scarce. Cora, the dataset we use later, has 2708 nodes but only 140 labeled training nodes. The graph structure is doing most of the work.
Mini Batching on a Huge Graph
Practical concerns
Sampling variance
Small fan-out → noisy embeddings, erratic validation curves
Solutions: increase fan-out, or average multiple inference samples
Oversmoothing
Too many layers → embeddings collapse to a single vector; low training accuracy
Solutions: use 2–3 layers or add residual connections
Featureless nodes
GraphSAGE requires node features (\(x_v\))
If missing: substitute degree, node type, or structural summaries
One-hot identity features make the model transductive
Feature scaling
Averaging neighbors distorts unscaled features
Normalize features before training
Isolated nodes
No neighbors = empty neighborhood; fallback is to use only the node’s features
Comparison to other models
GraphSAGE Next to Its Neighbors
Learns
Neighborhood
Scales by sampling
Inductive
node2vec
one vector per node
random walks
no
no
GCN
weight matrices
all neighbors, degree weighted
not as originally posed
architecture yes, standard training no
GraphSAGE
weight matrices
fixed size random sample
yes
yes
GAT
weights plus attention
all neighbors, learned weights
possible, with care
yes
How to read the table:
node2vec: Lookup table; works well for static graphs, can’t generalize to unseen nodes.
GCN: Aggregates all neighbors with fixed weights; processes the entire graph at once, architecture is generalizable.
GraphSAGE: Learns neighbor aggregation with sampling, enabling scalability and inductive capability.
GAT: Learns attention weights for neighbors; more expressive, can combine sampling and attention.
Model progression: - GCN introduced aggregation. - GraphSAGE enabled scalability and inductive learning. - GAT made aggregation learnable via attention.
When to Use GraphSAGE
Best suited for: - Large or growing graphs; need embeddings for new nodes (inductive) - Graphs too large for full-GPU processing - Nodes with meaningful features (not just IDs) - Highly skewed degree distributions with large hubs
Not ideal if: - Graph is small, fixed, and static; simpler models suffice - Nodes lack informative features or reasonable proxies - Most signal is in edge weights/types (vanilla GraphSAGE ignores edges) - Task requires distinguishing structures that message passing can’t separate
Example applications: - Pinterest (PinSage): large-scale recommendations - Fraud/abuse detection on dynamic platforms - Knowledge graphs, citation networks
Code Demo: Training GraphSAGE
Overview
The dataset: Cora
A citation network of 2708 machine learning papers
An edge means one paper cites another
Each node has a 1433 dimensional bag of words vector for its abstract
Each node has one of 7 subject labels
Only 140 nodes are labeled for training, which makes the graph structure essential
The task
Predict a paper’s subject area from its abstract and its citation neighborhood (multiclass classification)
Classes:
Case_Based: case-based reasoning, retrieving and adapting past solutions.
Genetic_Algorithms: evolutionary computation and related optimization.
Neural_Networks: connectionist models, the largest class in the dataset.
class GraphSAGE(nn.Module):"""A stack of GraphSAGE layers for node classification."""def__init__(self, in_channels, hidden_channels, out_channels, num_layers=2, dropout=0.5, aggr="mean"):super().__init__()if num_layers <2:raiseValueError("num_layers must be at least 2")self.dropout = dropoutself.convs = nn.ModuleList()# first layer: raw features -> hiddenself.convs.append(SAGEConv(in_channels, hidden_channels, aggr=aggr))# optional middle layers: hidden -> hiddenfor _ inrange(num_layers -2):self.convs.append(SAGEConv(hidden_channels, hidden_channels, aggr=aggr))# final layer: hidden -> one logit per classself.convs.append(SAGEConv(hidden_channels, out_channels, aggr=aggr))def reset_parameters(self):for conv inself.convs: conv.reset_parameters()def forward(self, x, edge_index):# all but the last layer get a nonlinearity and dropoutfor conv inself.convs[:-1]: x = conv(x, edge_index) x = F.relu(x) x = F.dropout(x, p=self.dropout, training=self.training)# last layer returns raw logits, so the loss can apply softmax itselfreturnself.convs[-1](x, edge_index)set_seed(CONFIG["seed"])model = GraphSAGE( in_channels=dataset.num_features, hidden_channels=CONFIG["hidden_channels"], out_channels=dataset.num_classes, num_layers=CONFIG["num_layers"], dropout=CONFIG["dropout"], aggr=CONFIG["aggr"],).to(DEVICE)print(model)print(f"\ntrainable parameters: {sum(p.numel() for p in model.parameters()):,}")
Aggregate neighbor vectors with the chosen aggr function
Combine with the node’s own vector through learned weights
Return the result, leaving the nonlinearity to us
PyTorch Geometric implements the combine step as two separate linear maps rather than one matrix on a concatenated vector. The two formulations are equivalent:
Splitting \(W\) into its left and right halves gives you \(W_{\text{self}}\) and \(W_{\text{neigh}}\).
Three conventions worth copying into your own work
The last layer returns raw logits, with no softmax. F.cross_entropy applies log softmax internally, and doing it twice is a classic silent bug.
Dropout goes between layers, never after the final one.
reset_parameters exists so you can rerun a search over many seeds without rebuilding the object.
Where the parameters live
With 1433 input features and 64 hidden units, layer one alone holds about 183 thousand weights. The graph has 2708 nodes and none of them own a parameter.
Train and Evaluate Functions
The two helpers below
train_epoch does one gradient step on the training nodes
evaluate reports accuracy on all three splits, with an optional different graph to score on
Code
def train_epoch(model, data, optimizer):"""One full-batch gradient step. Loss is computed on train nodes only.""" model.train() optimizer.zero_grad() logits = model(data.x, data.edge_index) loss = F.cross_entropy(logits[data.train_mask], data.y[data.train_mask]) loss.backward() optimizer.step()returnfloat(loss)@torch.no_grad()def evaluate(model, data, edge_index=None):"""Accuracy on each split. Pass edge_index to score on a different graph.""" model.eval() ei = data.edge_index if edge_index isNoneelse edge_index pred = model(data.x, ei).argmax(dim=-1) scores = {}for split in ["train", "val", "test"]: mask = data[f"{split}_mask"] scores[split] =float((pred[mask] == data.y[mask]).float().mean())return scores
Code
data = data.to(DEVICE)optimizer = torch.optim.Adam( model.parameters(), lr=CONFIG["lr"], weight_decay=CONFIG["weight_decay"],)best_val, best_state, epochs_without_gain =0.0, None, 0history = []for epoch inrange(1, CONFIG["epochs"] +1): loss = train_epoch(model, data, optimizer) scores = evaluate(model, data) history.append({"epoch": epoch, "loss": loss, **scores})if scores["val"] > best_val: best_val = scores["val"] best_state = {k: v.detach().clone() for k, v in model.state_dict().items()} epochs_without_gain =0else: epochs_without_gain +=1if epoch %20==0:print(f"epoch {epoch:3d} | loss {loss:.4f} | "f"train {scores['train']:.3f} | val {scores['val']:.3f}")if epochs_without_gain >= CONFIG["patience"]:print(f"early stopping at epoch {epoch}")break# always roll back to the checkpoint that scored best on validationmodel.load_state_dict(best_state)final = evaluate(model, data)print(f"\nbest val accuracy: {final['val']:.3f}")print(f"test accuracy: {final['test']:.3f}")
epoch  20 | loss 0.8093 | train 1.000 | val 0.776
epoch  40 | loss 0.1474 | train 1.000 | val 0.764
early stopping at epoch 53

best val accuracy:  0.784
test accuracy:      0.785
Result
Achieved ~78% test accuracy on 7-way classification (random ≈14%).
Training accuracy reaches 1.0 instantly; model easily memorizes 140 labeled nodes with 184k parameters.
Validation accuracy peaks, then drops—demonstrates overfitting; early stopping prevents further drift.
Best validation checkpoint restored before test evaluation—test accuracy not selected post hoc.
Cora is small and fixed-split; results can be noisy and prone to overfitting—ignore <2% differences.
Current setup uses all neighbors per node (full-batch); scalable only for small graphs. Sampling needed for larger datasets (next).
Testing the Inductive Claim
Code
data = data.to(DEVICE)# Build a graph in which every edge touching a test node has been deleted.# The model therefore never sees a test node's features or its connections.observed = data.train_mask | data.val_maskedge_index_observed, _ = subgraph( observed, data.edge_index, relabel_nodes=False, num_nodes=data.num_nodes)print(f"edges in full graph: {data.edge_index.size(1)}")print(f"edges during training: {edge_index_observed.size(1)}")set_seed(CONFIG["seed"])inductive_model = GraphSAGE( dataset.num_features, CONFIG["hidden_channels"], dataset.num_classes, CONFIG["num_layers"], CONFIG["dropout"], CONFIG["aggr"],).to(DEVICE)opt = torch.optim.Adam(inductive_model.parameters(), lr=CONFIG["lr"], weight_decay=CONFIG["weight_decay"])for epoch inrange(CONFIG["epochs"]): inductive_model.train() opt.zero_grad() logits = inductive_model(data.x, edge_index_observed) # reduced graph loss = F.cross_entropy(logits[data.train_mask], data.y[data.train_mask]) loss.backward() opt.step()# At inference we hand the model the FULL graph, test nodes and all.scores = evaluate(inductive_model, data, edge_index=data.edge_index)print(f"\naccuracy on nodes never seen during training: {scores['test']:.3f}")print(f"random-guess baseline for {dataset.num_classes} classes: "f"{1/dataset.num_classes:.3f}")
edges in full graph:     10556
edges during training:   690

accuracy on nodes never seen during training: 0.739
random-guess baseline for 7 classes:      0.143
The Inductive Result
Experimental setup - Removed all edges connected to test nodes (~690 of 10,556 edges remain) - Model trained without any access to test node features or neighbors - At inference, model receives the full graph and must classify test nodes
Results - Achieves test accuracy in the low/mid 70s, far above the 14% random baseline
Significance - Transductive models cannot handle unseen nodes; GraphSAGE generalizes by design - Learned function maps features and neighborhoods to embeddings for any node
Possible next steps
Evaluation - Run multiple random seeds; report mean ± std. - Use a true inductive split (not Planetoid masks). - Report confusion matrices, not just accuracy.
Hyperparameter Search - CONFIG is ready for tools like Optuna or Ray Tune. - Tune: hidden_channels, dropout, lr, num_neighbors, aggr.
Scaling Up - Use OGB datasets (ogbn-arxiv, ogbn-products). - Set num_workers for parallel sampling. - Use NeighborLoader for large-graph inference.
Model Variations - Try aggr="max" for max pooling. - Add residuals if >2 layers. - Insert batch norm. - Swap SAGEConv for GATConv if desired.
Engineering Best Practices - Log metrics with WandB or MLflow. - Save checkpoints and CONFIG together. - Pin package versions.
Summary
The core idea
GraphSAGE learns a function that builds embeddings from features and neighborhoods, instead of a table that stores one embedding per node.
The three steps, one more time
Sample a fixed number of neighbors, so cost per node is constant
Aggregate them with a permutation invariant function, usually the mean
Update by concatenating with the node’s own vector, applying learned weights, a nonlinearity, and L2 normalization
Why the design choices exist
Choice
Reason
Fixed size sampling
Bounded memory, works on skewed degree distributions
Permutation invariance
A neighborhood is a set, with no natural ordering
Concatenate rather than merge
Keeps the node’s own signal distinguishable
Shared weights across nodes
The parameter count is independent of graph size
Two layers
Enough reach without oversmoothing
The consequences
New nodes get embeddings with no retraining
Training scales to graphs that do not fit in memory
The same trained model transfers to a related graph it has never seen
The limits
Needs meaningful node features
Ignores edge weights and edge types in its basic form
Two hops is a real horizon, and some signals live further away
Recommended reading
The original paper
Hamilton, W. L., Ying, R., and Leskovec, J. (2017). Inductive Representation Learning on Large Graphs. NeurIPS. Short, readable, and worth an hour.
Direct descendants
PinSage (Ying et al., 2018), the Pinterest system that took these ideas to billions of nodes
GAT (Velickovic et al., 2018), which replaces the fixed aggregator with learned attention
Cluster-GCN and GraphSAINT, alternative answers to the same scaling problem
Books and courses
Hamilton, Graph Representation Learning (2020), freely available online
Stanford CS224W, with lecture videos posted publicly
Practice
The PyTorch Geometric example gallery
Open Graph Benchmark, for datasets and leaderboards at realistic scale
A good next exercise
Take the notebook above and swap SAGEConv for GATConv. Nothing else needs to change. Compare accuracy, parameter count, and training time, and see whether attention earns its cost on Cora.